This Excel workbook provides a complete toolkit for DBM / Marshall mix design for highway projects. It is designed for civil engineers, QA/QC professionals, and site supervisors to calculate, document, and visualize mix design results in a professional and structured way. All tabs are pre-filled with sample data, making it suitable for learning, reference, or immediate use.
Included Tabs & Features
Cover Page & Abstract – Professional project summary with highway section and engineer details
Trial Mixes 1, 2 & 3 – Pre-filled with aggregate, bitumen content, VMA, VFB, Marshall Stability & Flow
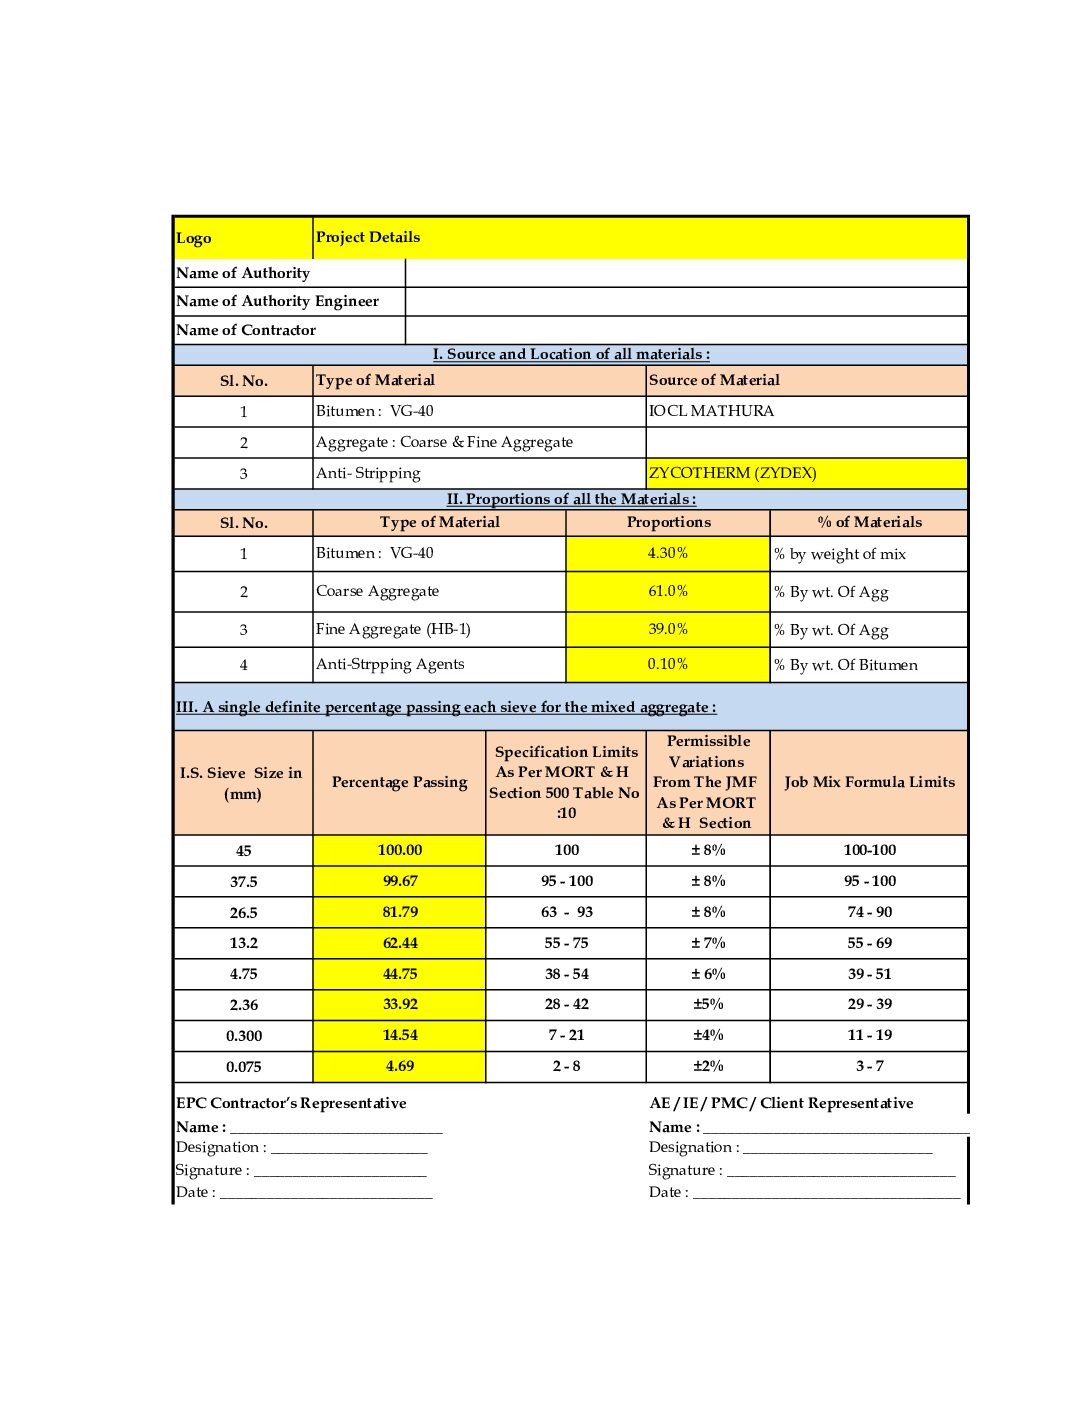
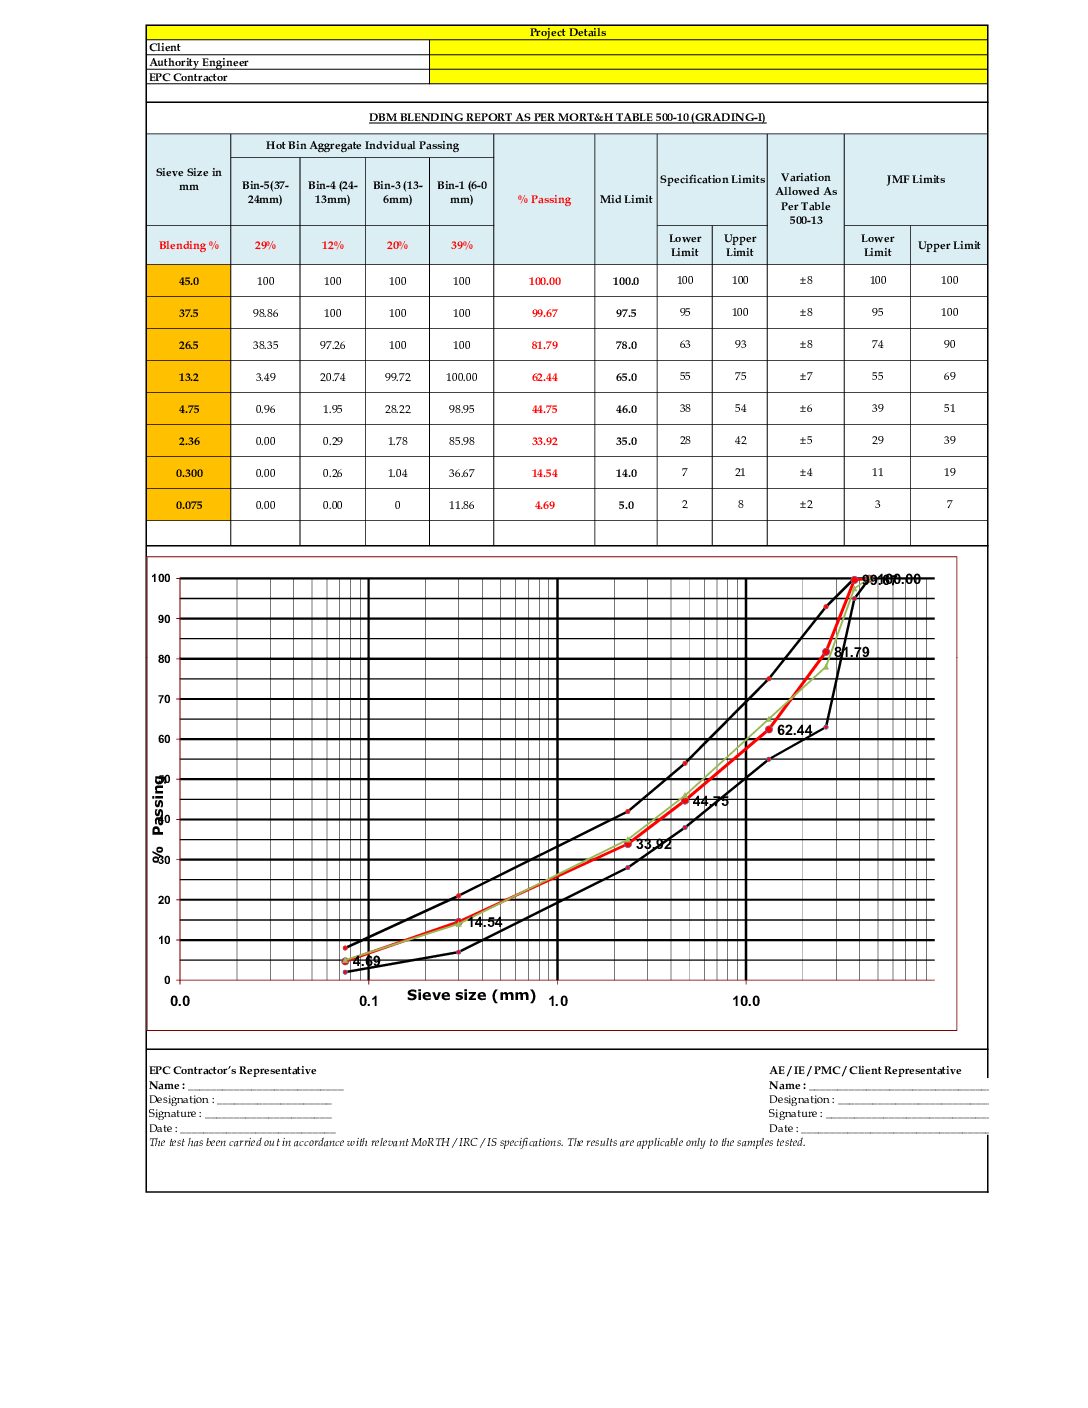
Aggregate Blending Sheet – Calculates proportions to meet target gradation and displays grading curves
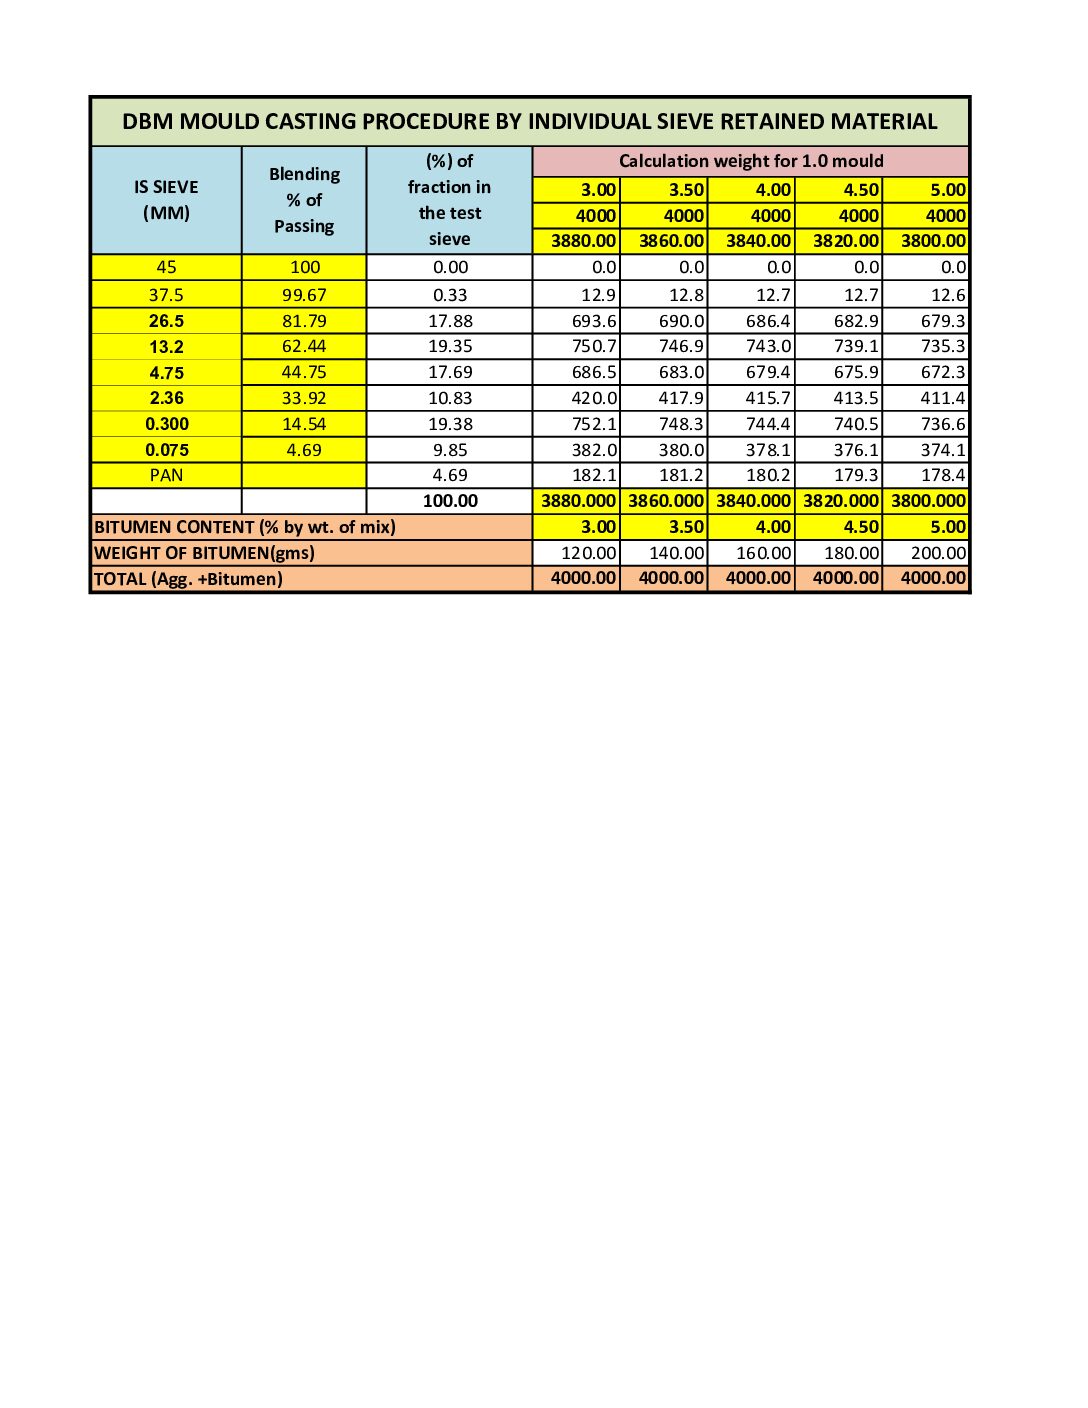
DBM Mould Casting Quantities – Material required per specimen for laboratory tests
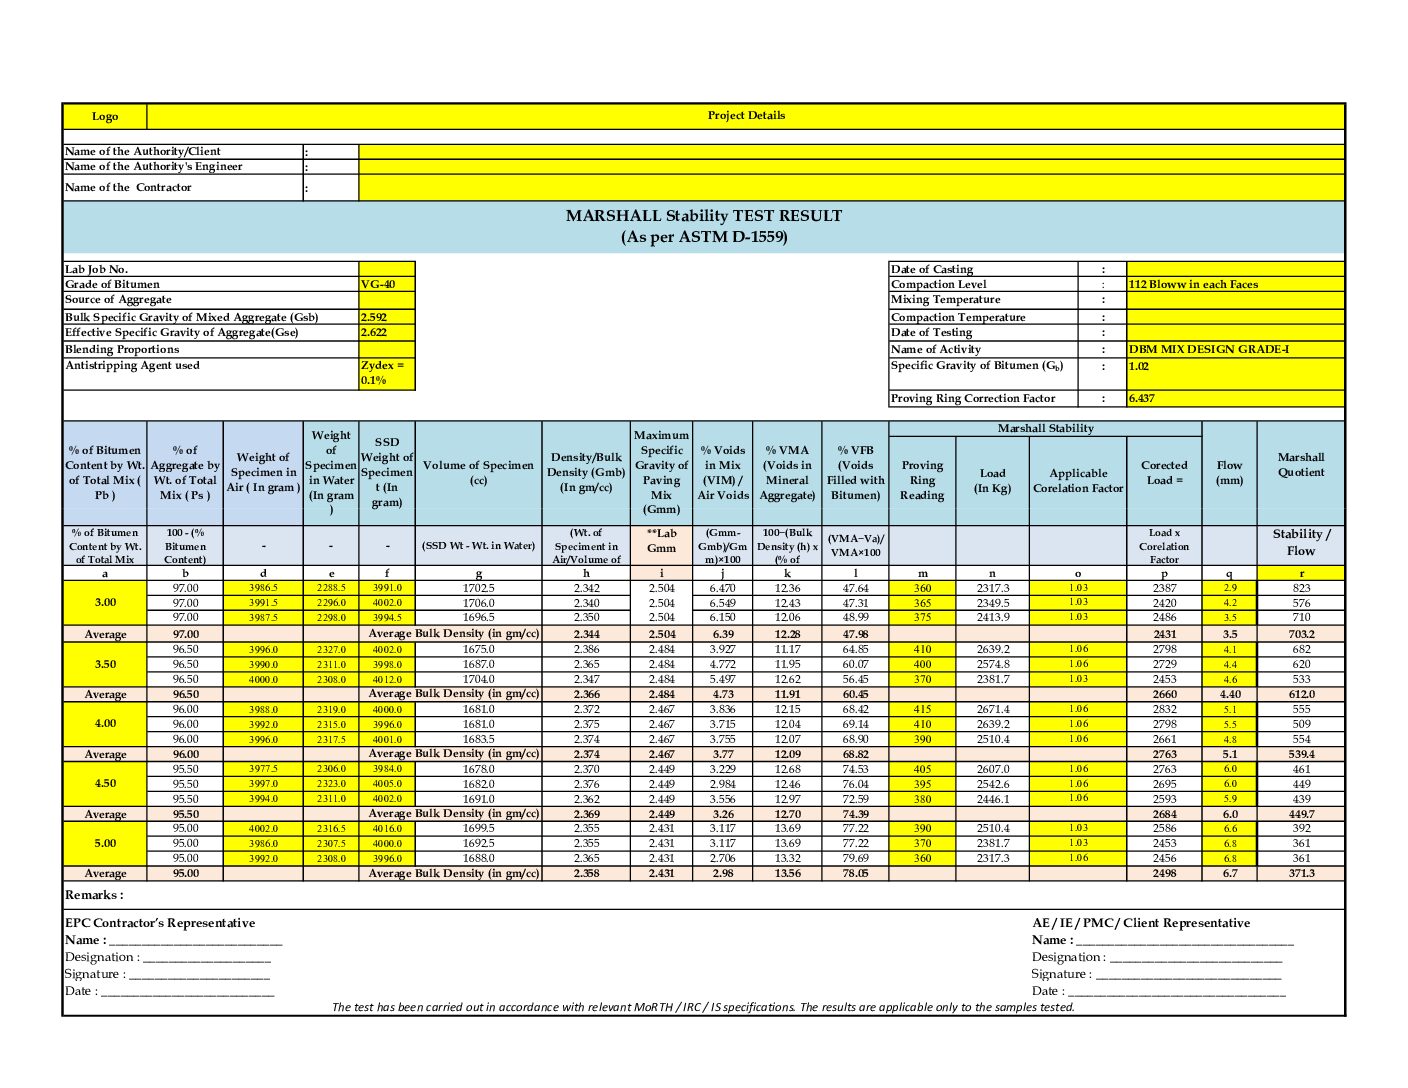
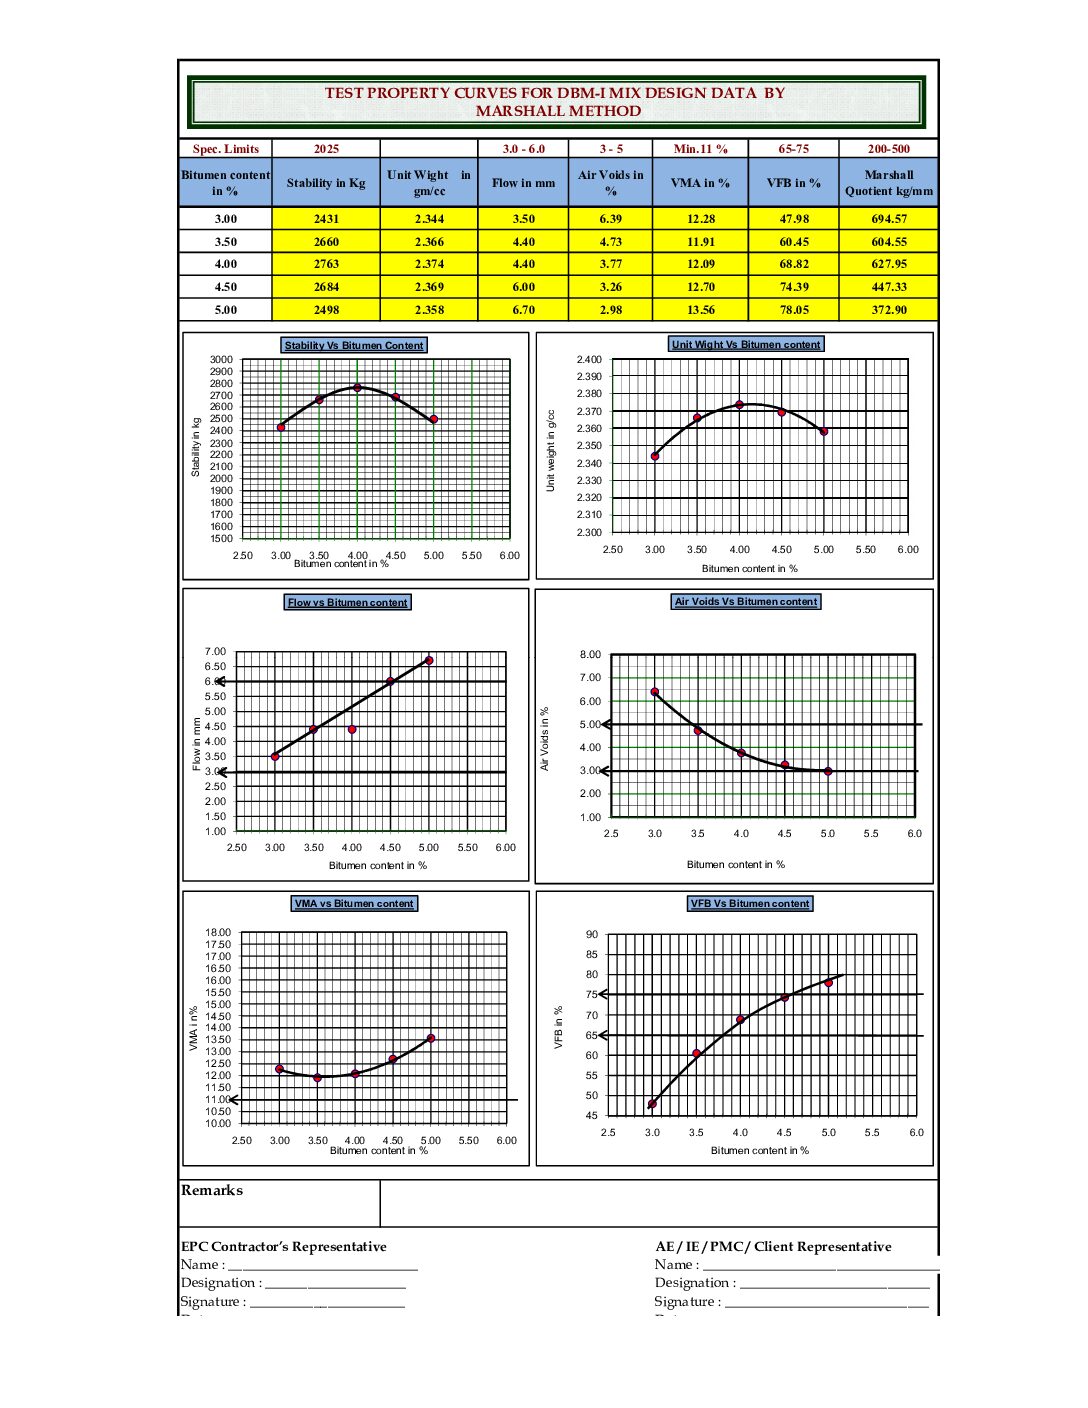
Marshall Test Sheet – Stability, Flow, Marshall Quotient, Bulk Density, Air Voids, with automatically generated graphs
Gmm / Maximum Specific Gravity – Lab calculations with pass/fail alerts
Confirmatory Marshall / Refusal Density – QA/QC evaluation included
Water Sensitivity / TSR & Stripping Value – Sample calculations and charts for moisture damage assessment
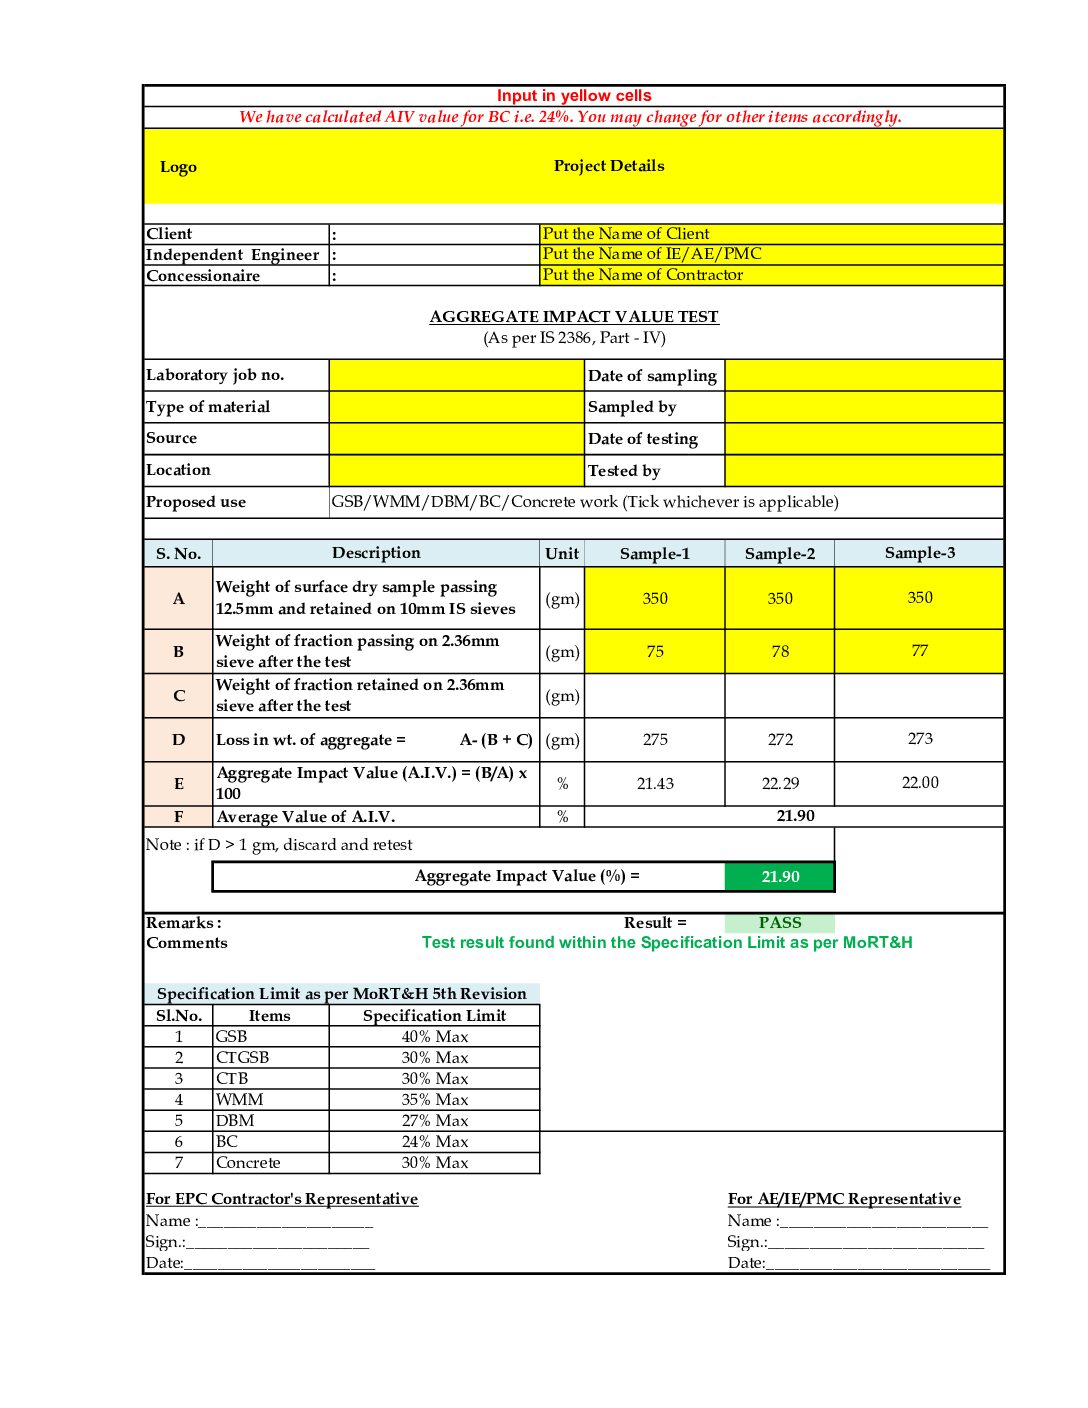
Bitumen & Aggregate Properties – Specific Gravity, OBC bar chart, Ductility, Solubility, AIV, EIFI, LL/PI, Cone & Log, Cleanliness of 10, 20, 40 sieve + sand
Surface & Field QA/QC – Core density with standard deviation, surface regularity checks
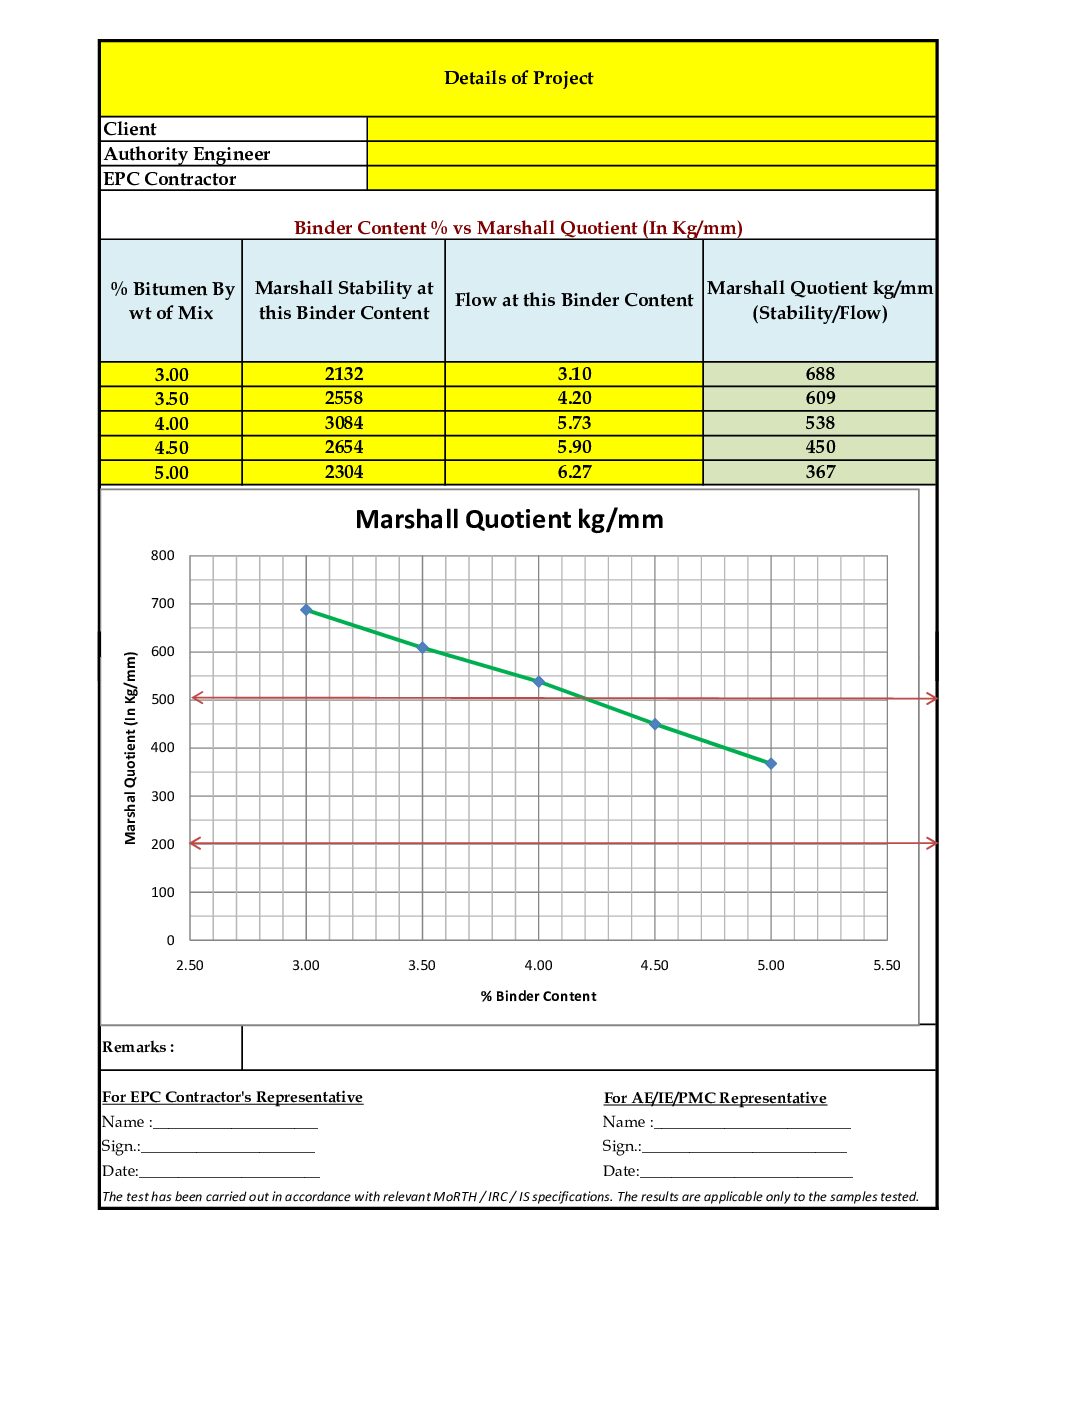
Graphs & Charts – Stability vs Binder, Flow vs Binder, Marshall Quotient, Gradation, OBC bar charts
Final Mix Design Summary – Printable, report-ready overview suitable for client or lab submission
Screenshot Previews
Cover Page & Abstract – Professional project summary
Trial Mix 1 Tab – Sample data for initial trial mix calculations
Aggregate Blending Graph – Visual representation of blended gradation
Marshall Stability & Flow Chart – Visual guide for binder content optimization
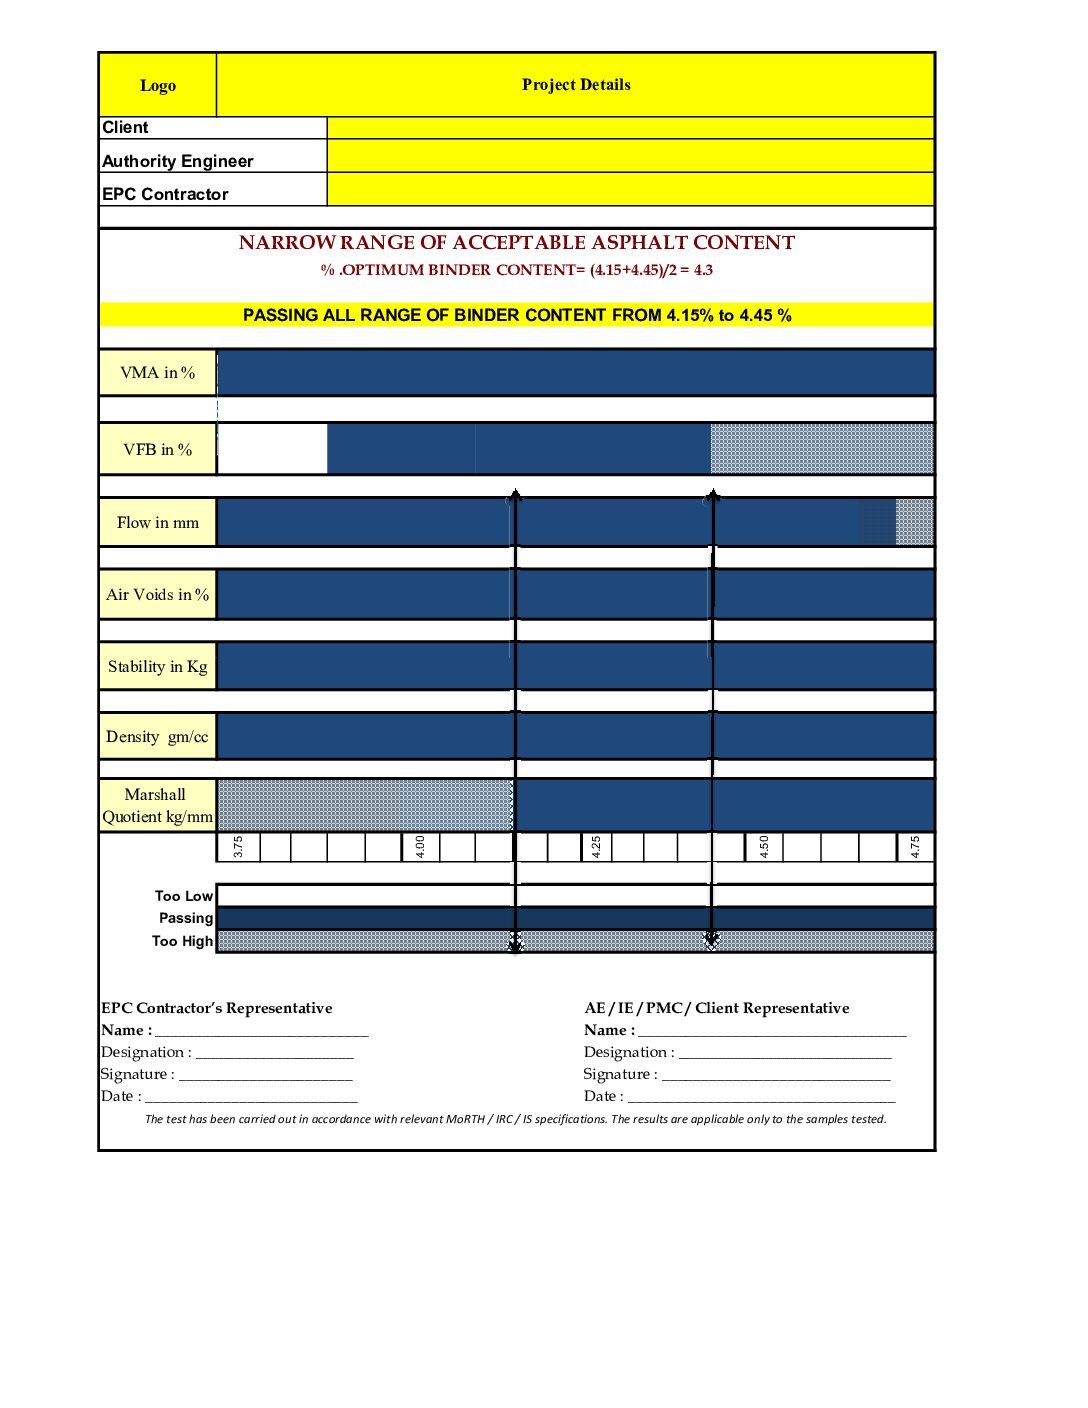
Optimum Bitumen Content (OBC) Bar Chart – Comparison of binder requirements
Core Density with Standard Deviation – Field QA/QC data visualization
Final Mix Design Summary – Printable report-ready overview
Water Sensitivity & TSR Chart – Moisture damage evaluation
File Details
Format: Excel Workbook (.xlsx)
Tabs: Cover Page, Abstract, Trial 1/2/3, Blending, Mould Qty, Marshall, Gmm, Water Sensitivity, Bitumen, Aggregate Tests, Surface QA/QC, Graphs, Final Summary
Pre-filled with sample data for quick reference and learning
Printable and professional layout
Key Benefits
Fully editable for any highway project
Automatic calculations and graphs for easier interpretation
Structured format for documentation and reporting
Pass/fail alerts per IRC / MoRTH standards
Includes ready-made graphs and charts for presentations
Suitable for educational and professional use
How to Use
Open the Excel workbook
Enter your project details, aggregate, and binder properties
Review trial mix calculations
Check automatic graphs & pass/fail alerts
Print the Final Mix Design Summary for submission