Highway Quality Test

HIGHWAY QUALITY TEST

(Highway Engineering • Testing • Performance Assurance)

Kishor Kumar

What is Bitumen? Grade, Types, Properties

Bitumen is a viscous, black, sticky, and highly cementitious substance derived from crude petroleum through a refining process. It is primarily composed of hydrocarbons and their derivatives. Often referred to as asphalt cement in North America, bitumen is best known for its use as the binding agent in asphalt concrete for road construction, paving, and roofing applications.
________________________________________

What is Bitumen? Grade, Types, Properties Read More »

pqclaying

PQC Methodology

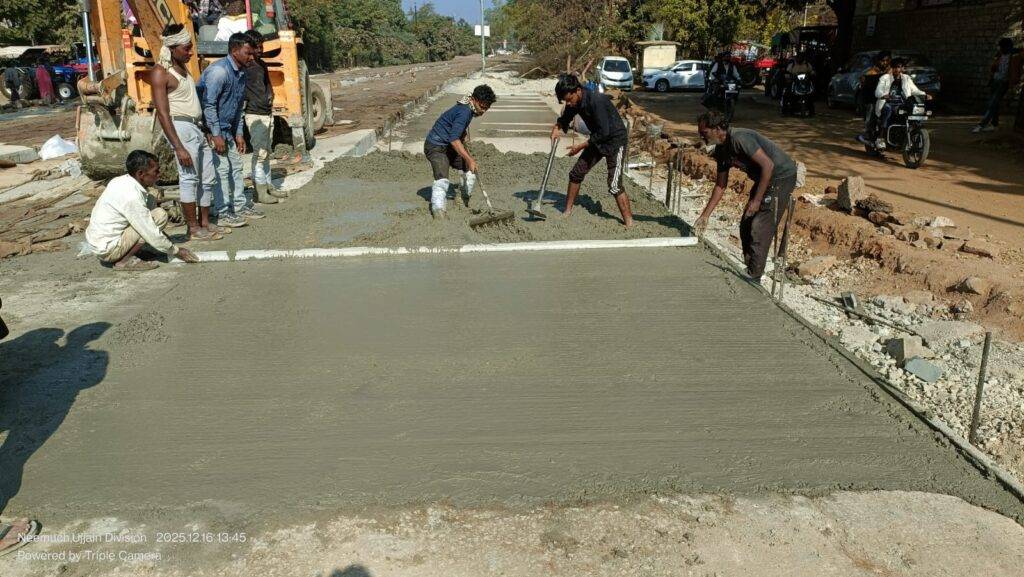
Pavement Quality Concrete (PQC) M40: Complete Construction & QA/QC Guide Pavement Quality Concrete (PQC) of M40 grade forms the structural load-bearing layer in rigid pavements of National Highways. This guide provides a detailed overview of materials, mixing, placement, curing, joint detailing, dowel and tie bar installation, and quality assurance/quality control (QA/QC) procedures. It also highlights common issues, their solutions, and aligns with MoRTH Section 602 and IRC standards. For more insights, see the main pillar page on Rigid Pavement Components. Applicable Standards: MoRTH Section 602 IRC:15 IRC:44 IRC:SP:62 1. Understanding PQC PQC is a high-strength concrete layer designed to transfer traffic loads directly to the subgrade through slab action. It is especially suited for highways with heavy traffic, high axle loads, and long-term durability requirements. Benefits of PQC include: Exceptional flexural strength and load transfer capacity Durable surface resistant to rutting and deformation Expected service life of 30–40 years Reduced long-term maintenance requirements Resistance against oil, water, and temperature-induced damage 2. Material Specifications for M40 PQC 2.1 Cement Use Ordinary Portland Cement (OPC) of grade 43 or 53 from approved suppliers. Maintain a cement content of 350–425 kg/m³. Ensure proper initial and final setting times. Store cement in dry, ventilated conditions, and check for lumps or moisture contamination. 2.2 Aggregates Aggregates must comply with IS 383 standards. Use crushed stone aggregates with a well-graded size distribution. Keep deleterious material content below 3%. Measure moisture content prior to batching to correctly adjust the water-cement ratio. For National Highways, use coarse aggregates with a nominal size of 20 mm. 2.3 Water Only clean, potable water should be used, free from salts, oil, or organic matter. Maintain a water-cement ratio between 0.40–0.45 to ensure workability and strength. 2.4 Admixtures Use IS 9103 compliant chemical admixtures to enhance workability, control setting time, or reduce water content. Calcium chloride is prohibited according to MoRTH regulations. 2.5 Dry Lean Concrete (DLC) vs PQC Dry Lean Concrete (DLC) serves as the base layer for rigid pavements, providing a stable working platform for the placement of Pavement Quality Concrete (PQC). A typical DLC layer has a thickness of 150 mm and is compacted to 97% of the Proctor density. The PQC layer is then placed on top of DLC to transfer structural loads efficiently to the subgrade. 3. Dowel and Tie Bar Installation Dowel and tie bars are crucial for load transfer and slab alignment. Correct placement minimizes faulting, corner breaks, and joint failures. 3.1 Dowel Bars Use mild steel S240 or epoxy-coated bars. Diameter: 25–32 mm, Length: 500–600 mm depending on slab thickness. Place at mid-slab depth with a tolerance of ±20 mm. Align bars parallel to the pavement centerline, with one end coated as a bond breaker. 3.2 Tie Bars Use deformed steel Fe415 for longitudinal reinforcement. Position tie bars at longitudinal joints, in the middle third of the slab depth. Coat the ends with bituminous paint for a length of 75 mm. 4. Step-by-Step Construction Workflow 4.1 Subgrade Preparation The subgrade forms the foundation of rigid pavements, and proper preparation is essential for long-term PQC performance. Poor subgrade work can cause differential settlement, pumping, faulting, and premature cracking. Key Steps: Survey & Proof Rolling: Conduct a thorough survey to locate low spots, soft zones, and uneven areas. Use a loaded roller or light truck to identify weak regions requiring stabilization or excavation. Excavation & Trimming: Remove soft or unsuitable soils to reach the design depth, and trim the subgrade to ensure consistent slope and crossfall for drainage. Compaction: Compact the subgrade in layers of 150–200 mm using a vibratory roller, achieving a minimum of 97% Proctor density as per MoRTH standards. Proper compaction reduces settlement under traffic loads. Moisture Control: Maintain optimum moisture content during compaction. Excess water can lead to pumping, while too little moisture reduces compaction efficiency. Drainage Provision: Ensure adequate drainage with temporary side drains, cross drains, or filter layers to prevent waterlogging. Subgrade Proofing: Conduct a CBR test or plate load test to verify strength. Areas below the specified values (typically ≥ 8% CBR for National Highways) should be stabilized using lime or cement. Pro Tip: Keep a detailed log of compaction, moisture, and test results for QA/QC compliance. Untreated soft spots can compromise even high-quality PQC layers. 4.2 Dry Lean Concrete (DLC) Placement DLC provides a uniform, stable platform for PQC and helps prevent early-age cracking. Although it is not load-bearing, proper placement and compaction significantly influence the performance of the PQC above. Mix Design: Use a 1:4:8 ratio (cement:sand:aggregate) with 3–5% moisture content. The mix should be stiff but workable to allow proper compaction. Placement Methods: Employ fixed formwork or slip-form pavers, ensuring straight edges and level surfaces as per drawings. Compaction: Compact the DLC with vibratory rollers or tamping screeds to at least 95% of maximum dry density. Adequate compaction prevents voids that can transfer stresses to PQC. Curing: Apply wet hessian or a curing compound for 7 days to maintain moisture. Proper curing reduces shrinkage cracks that may reflect in the overlying PQC. Insight: Many rigid pavement failures originate from weak or uneven DLC layers, making careful preparation a critical quality control checkpoint. 4.3 Pavement Quality Concrete (PQC) Placement Accurate PQC placement is crucial for uniform thickness, flatness, and long-term pavement durability. Following these best practices ensures high-quality results: Continuous Supply: Use concrete from a computerized batching plant to maintain consistent water-cement ratio, aggregate grading, and admixture dosing. Paver Operation: Employ slip-form pavers for continuous placement. Use vibratory screeds or internal vibrators to eliminate honeycombing and ensure full consolidation. Thickness & Camber: Follow MoRTH guidelines for slab thickness (typically 300–350 mm for National Highways) with a tolerance of ±10 mm. Check the camber to prevent water ponding on the surface. Temperature Management: In hot weather, reduce water content, use retarders, and schedule placement during cooler hours. For cold weather, consider heated aggregates or insulated blankets. Joint Planning: Identify contraction, expansion, and construction joints before placement to ensure proper load transfer and avoid ad-hoc cuts. 4.4 Finishing

PQC Methodology Read More »

Absolute Vicosity Test

Absolute Viscosity Test of Bitumen – Cannon Manning Vacuum Capillary Viscometer (ASTM D2171) Absolute Viscosity Test of Bitumen – ASTM D2171 The Absolute Viscosity Test measures the flow resistance of bitumen using a Cannon-Manning Vacuum Capillary Viscometer. This method is widely used for quality control of paving-grade bitumen. 1. OBJECTIVE To determine the absolute viscosity of bitumen using the Cannon-Manning Vacuum Capillary Viscometer at a controlled temperature under a vacuum. 2. APPARATUS Constant Temperature Bath (accuracy ±0.1 °C). Silicone Oil Bath (up to 150 °C) or Water Bath (up to 100 °C). Vacuum System (maintains ±0.05 cm Hg accuracy up to 30 cm Hg). Stopwatch (accuracy 0.5 sec). Cannon-Manning Vacuum Viscometers (Size 12 & Size 13). Viscometer Stand (for 6 tubes). 3. PROCEDURE Collect bitumen sample in a clean container. Heat the sample to 135 ± 5.5 °C. Pour into viscometer up to the fill mark (±2 mm of line E). Allow sample to stand for 10 ± 2 minutes to release air bubbles. Transfer viscometer into the bath maintained at 60 °C. Connect the viscometer to vacuum pump and apply 30 cm Hg vacuum. Start the stopwatch and record the time (T sec) for bitumen to flow from Mark G to Mark H. 4. CALCULATION Formula for Absolute Viscosity Absolute Viscosity (Poises) = K × T K = Calibration factor of viscometer (Poises/sec) T = Flow time in seconds 5. RESULTS The absolute viscosity of the bitumen sample is reported in Poises at 60 °C under a vacuum of 30 cm Hg. Quick Reference: Absolute Viscosity Test (ASTM D2171) Standard: ASTM D2171 – Viscosity by Vacuum Capillary Viscometer Purpose: To measure the flow resistance of bitumen at 60 °C under vacuum Required Vacuum: 30 cm Hg (maintained ±0.05 cm Hg) Test Temperature: 60 °C (constant temperature bath, accuracy ±0.1 °C) Viscometer Used: Cannon–Manning Vacuum Capillary Viscometer (Size 12/13) Sample Heating: Heat bitumen to 135 ± 5.5 °C before pouring in viscometer Flow Timing: Time recorded for bitumen flow between Mark G → Mark H Viscosity Formula: Absolute Viscosity (Poises) = K × T K: Calibration factor of viscometer (provided by manufacturer) T: Flow time in seconds Top 10 FAQs – Absolute Viscosity Test of Bitumen (ASTM D2171) What is the Absolute Viscosity Test? It measures the resistance of bitumen to flow at 60 °C using a vacuum capillary viscometer under a fixed vacuum of 30 cm Hg. Why is a vacuum used in this test? Vacuum minimizes air bubbles and ensures controlled laminar flow inside the capillary tube. Which viscometer is used? Cannon-Manning Vacuum Capillary Viscometer (typically Size 12 for paving grades). What is the test temperature? 60 °C (±0.1 °C). How is viscosity calculated? Viscosity = K × T, where K is calibration factor and T is flow time. Minimum sample heating temperature? 135 ± 5.5 °C before pouring. How long should bitumen stand after filling? 10 ± 2 minutes to release trapped air. Precision required for timing? Stopwatch accurate to 0.5 sec. Typical viscosity values? 800 – 4000 Poises at 60 °C for paving grade bitumen. Why 60 °C? It represents the typical temperature of bitumen in service on roads. Prepared by Kishor Kumar | Source: HighwayQualityTest.com 🧪 Bitumen Laboratory Tests – Arranged as per IS Codes ✔ Penetration Test of Bitumen – IS 1203 ✔ Softening Point of Bitumen (Ring & Ball) – IS 1205 ✔ Absolute Viscosity Test of Bitumen – IS 1206 (Part 2) ✔ Ductility Test of Bitumen – IS 1208 ✔ Bitumen Extraction Test – IS 2720 (Part 39) ✔ Marshall Stability & Flow Test – ASTM D6927 / MoRTH

Absolute Vicosity Test Read More »

Ductility Test

Ductility Test of Bitumen – Procedure, Apparatus & Limits (IS Method) Home › Bitumen Tests › Ductility Test Ductility Test of Bitumen – Complete Guide Learn the step-by-step procedure, apparatus, sample preparation, calculation, and result interpretation for ductility testing of bitumen, as per IS 1208 standard. Explore other bitumen testing guides for complete QA/QC in highway construction. Introduction The Ductility Test measures the ability of bitumen to deform under tensile stress without breaking. This property is crucial for highway construction, as it indicates flexibility of bituminous pavements and resistance to cracking under traffic loads and temperature variations. Objective To determine the ductility of bituminous material, which measures the distance a bitumen sample can stretch before breaking. Purpose of Ductility Test Assess tensile property and flexibility of bitumen. Ensure bitumen can withstand temperature variations without cracking. Determine suitability of bitumen for highway surfacing works. Applicable Standards IS 1208: Ductility of Bitumen – Standard Method Apparatus Required Ductility testing apparatus with movable clamp and water bath. Test mould (100 mm × 10 mm × 3 mm). Hot knife, thermometer, stopwatch. Water bath maintained at 27 ± 0.5°C. Sample Preparation Heat bitumen sample to a fluid state without overheating. Strain the molten bitumen through a 90-micron sieve to remove impurities. Pour into the standard test mould carefully to avoid air bubbles. Allow it to stand for 30–40 minutes, then place the mould in a water bath at 27°C for 30 minutes. Remove mould, level surface using a hot knife, then return to water bath for 85–95 minutes. Remove mould sides and attach clips to the ductility machine carefully without applying initial strain. Visual Stepwise Guide Stepwise illustration showing apparatus, sample preparation, and testing process for ductility of bitumen. Test Procedure Immerse the prepared sample in the water bath maintained at 27 ± 0.5°C. Attach the sample ends to the movable and fixed clamps of the ductility apparatus. Start the apparatus and allow the movable clamp to move at a speed of 5 cm/min (50 ± 2.5 mm/min). Ensure the sample remains immersed in water at a depth of at least 10 mm throughout the test. Record the distance (cm) at which the bitumen thread breaks. This distance is the ductility value. Repeat the test for three specimens and calculate the average. Observation & Calculation The ductility of bitumen is expressed in centimeters (cm). Formula: Ductility (cm) = Average length at which bitumen breaks Compare the result with IS 1208 recommended minimum values for the particular bitumen grade. Result Interpretation High ductility indicates good flexibility and resistance to cracking. Low ductility may indicate hard or aged bitumen unsuitable for flexible pavements. Typical values: 75–100 cm for penetration grade bitumen (VG-10, VG-20, VG-30). Limits (IS Requirements) A35 & S35 Grade: Minimum ductility = 50 cm at 27°C Other Grades: Minimum ductility = 75 cm at 27°C Common Mistakes Heating bitumen above recommended temperature (overheating reduces ductility). Air bubbles in sample causing early break. Improper water bath temperature control. Non-uniform sample thickness or trimming errors. Related Bitumen Tests Bitumen Penetration Test Learn IS 1203 & ASTM D5 procedure, apparatus, sample prep, and result interpretation. Softening Point Test Determine temperature at which bitumen softens, as per IS 1205 / ASTM D36. Absolute Viscosity Test Understand quality checks for bituminous materials under IS 1206 (Part 2). Bitumen Extraction Test To determine percentage of binder (bitumen) in a bituminous mix by cold solvent extraction using a centrifugal extractor (ASTM D2172) . Browse by Test Category Soil Tests Aggregate Tests Bitumen Tests Concrete Tests Frequently Asked Questions Why is ductility important in bitumen? Ductility shows how much the bitumen can stretch without breaking. Flexible bitumen reduces cracking in pavements under traffic and temperature changes. Learn about other bitumen tests here. What is the standard temperature for the test? The test is performed at 27 ± 0.5°C according to IS 1208. How many specimens should be tested? Three specimens should be tested and the average length recorded as the ductility value.

Ductility Test Read More »

bitumen_extractor

Bitumen Extraction test

The Bitumen Extraction Test is a laboratory method used to determine the actual bitumen content present in a bituminous mix by separating the binder from aggregates using a suitable solvent. This test is essential for quality control, mix design verification, and compliance with MoRTH / IS:2720 (Part 2) and ASTM standards. Accurate bitumen content ensures proper pavement durability, strength, and resistance to deformation.

Bitumen Extraction test Read More »

Flakiness & Elongation Test

Flakiness & Elongation Index Test – Method Statement Flakiness & Elongation Index Test – IS 2386 Procedure with Calculation Procedure • Apparatus • IS Sieve Table • Results format OBJECT Assess aggregate particle shape quality using the Flakiness & Elongation Index Test as per IS 2386 (Part I). This essential aggregate shape test determines the percentage of flaky and elongated particles that can adversely affect compaction, interlocking, and overall pavement performance. Excessive flaky and elongated aggregates reduce load-bearing capacity, increase voids, and lead to premature failures such as rutting, cracking, and surface deformation in flexible pavements. Therefore, strict compliance with IS specifications is critical for ensuring structural durability and long service life. This practical, site-ready guide covers: Required apparatus and gauge dimensions Step-by-step laboratory procedure Calculation formulas for Flakiness Index (FI) and Elongation Index (EI) Permissible limits as per MoRTH and IS standards Interpretation tips for QA/QC engineers Designed specifically for site engineers, QA/QC teams, and highway professionals, this guide ensures accurate testing, proper documentation, and informed decision-making for high-performance pavement construction. APPARATUS The apparatus for the shape tests consists of the following: A standard thickness gauge A standard length gauge IS sieves of sizes: 63, 50, 40, 31.5, 25, 20, 16, 12.5, 10 and 6.3 mm A balance of capacity 5 kg, readable and accurate up to 1 g THEORY The particle shape of aggregates is determined by the percentages of flaky and elongated particles contained in it. For base course and construction of bituminous and cement concrete types, the presence of flaky and elongated particles is considered undesirable as these cause inherent weakness with possibilities of breaking down under heavy loads. Thus, evaluation of shape of the particles, particularly with reference to flakiness and elongation is necessary. In highway projects, excessive flaky and elongated particles increase void content in bituminous mixes, leading to poor compaction, reduced Marshall Stability, and higher susceptibility to rutting under traffic loads. The Flakiness Index of aggregates is the percentage by weight of particles whose least dimension (thickness) is less than three-fifths (0.6 times) of their mean dimension. This test is not applicable to sizes smaller than 6.3 mm. The Elongation Index of an aggregate is the percentage by weight of particles whose greatest dimension (length) is greater than nine-fifths (1.8 times) their mean dimension. This test is not applicable for sizes smaller than 6.3 mm. PROCEDURE Sieve the sample through the IS sieves (as specified in the table below). Take a minimum of 200 pieces of each fraction to be tested and weigh them, or take the maximum number available up to 200 pieces. To separate the flaky materials, gauge each fraction for thickness on a thickness gauge. The width of the slot used should be of the dimensions specified in column (4) of the table for the appropriate size of the material. Weigh the flaky material passing the gauge to an accuracy of at least 0.1% of the test sample. To separate the elongated materials, gauge the non-flaky material for length on a length gauge. The width of the slot used should be of the dimensions specified in column (6) of the table for the appropriate size of the material. Weigh the elongated material retained on the gauge to an accuracy of at least 0.1% of the test sample. … IS SIEVE & GAUGE TABLE Passing through IS Sieve, mm Retained on IS Sieve, mm Weight of fraction (200 pieces), g Thickness gauge size, mm Weight passing thickness gauge (Xi) Length gauge size, mm Weight retained on length gauge (Yi) 63 50 W1 23.90 X1 – – 50 40 W2 27.00 X2 81.00 Y1 40 31.5 W3 19.50 X3 58.00 Y2 31.5 25 W4 16.95 X4 – – 25 20 W5 13.50 X5 40.5 Y3 20 16 W6 10.80 X6 32.4 Y4 16 12.5 W7 8.55 X7 25.5 Y5 12.5 10 W8 6.75 X8 20.2 Y6 10 6.3 W9 4.89 X9 14.7 Y7 Total W = X = Y = OBSERVATIONS and: FORMULAE Record every fraction’s weights clearly. Use at least two significant figures for percentages and record sample piece counts. Flakiness Index = ((X1 + X2 + …) / (W1 + W2 + …)) × 100 Elongation Index = ((Y1 + Y2 + …) / (W1 + W2 + …)) × 100 Fraction Total pieces taken (Wi) Flaky weight (Xi) Elongated weight (Yi) Remarks 63–50 mm 50–40 mm 40–31.5 mm 31.5–25 mm 25–20 mm 20–16 mm 16–12.5 mm 12.5–10 mm 10–6.3 mm Total RESULT I. Flakiness Index = X II. Elongation Index = Y NOTES & REFERENCES This document preserves the original technical content. Do not alter the definitions if your contract specification references a specific IS edition. Reference: IS 2386 Part 1 – Methods of Test for Aggregates for Concrete (Particle Shape Tests). Record environmental conditions and the balance calibration status with every test batch for traceability. Permissible Limits as per MoRTH Application Combined FI + EI Limit Bituminous Concrete (BC) ≤ 30% Dense Bituminous Macadam (DBM) ≤ 35% Wet Mix Macadam (WMM) ≤ 35% Note: Always verify latest MoRTH revision applicable to your contract. Document: • Generated: 20 Nov 2025 Enter Values to Calculate Indices W Values X Values Y Values Calculate Results: Flakiness Index: 0% Elongation Index: 0% Quick Reference: Flakiness & Elongation Index Test Applicable Aggregate Size: Only aggregates ≥6.3 mm are tested. Minimum Sample Count: 200 pieces per sieve fraction (or maximum available). Flakiness Index Criterion: Particles with thickness < 0.6 × mean size. Elongation Index Criterion: Particles with length > 1.8 × mean size. Required Gauges: Thickness gauge for flakiness; Length gauge for elongation. Accuracy: Weigh materials to at least 0.1% accuracy of sample weight. Outcome: FI = (Flaky Weight / Total Weight) × 100; EI = (Elongated Weight / Total Weight) × 100. Purpose: Ensures aggregates are suitable for pavement and concrete strength requirements. Top FAQs – Flakiness & Elongation Index Test What is the minimum aggregate size for these tests? Aggregates smaller than 6.3 mm are not tested. Why are flaky and

Flakiness & Elongation Test Read More »

concrete_cube_image

Compressive Strength of Cube

Concrete Cube Test – IS 516 Procedure, Compressive Strength & Formula 1. Objective The Concrete Cube Test as per IS 516 is the standard method used to determine the compressive strength of concrete for pavements, buildings, bridges, and structural elements. It verifies whether the concrete supplied at site meets the specified grade requirements and ensures structural safety and durability. This test involves preparing, casting, curing, and testing concrete cube specimens of size 150 × 150 × 150 mm or 100 × 100 × 100 mm to determine compressive strength at specified ages — typically 7 days (early strength assessment) and 28 days (characteristic strength verification). The procedure includes: Proper mould preparation and oiling Sampling of fresh concrete as per standard practice Layer-wise filling and compaction (tamping/vibration) Initial setting period and demoulding after 24 ± ½ hours Water curing under controlled temperature conditions Compression testing using a calibrated Compression Testing Machine (CTM) Calculation of compressive strength (Load / Cross-sectional Area) Accurate execution of cube testing ensures: Verification of concrete grade (M20, M25, M30, etc.) Early detection of batching or mix design issues Compliance with project specifications and quality control norms Long-term durability and structural performance Designed for site engineers, QA/QC teams, laboratory technicians, and project managers, this guide provides practical, step-by-step instructions to ensure reliable results and compliant construction practices. 2. Apparatus Required Cube moulds – 150 mm or 100 mm Mixing tray and scoop Tamping rod (16 mm diameter) Trowel Concrete mixer (if required) Curing tank (27 ± 2°C) Compression Testing Machine (CTM) 3. Preparation of Cube Moulds Clean moulds to remove dust and hardened mortar. Assemble moulds properly and tighten bolts. Apply thin uniform oil layer on internal faces. Check alignment and squareness of mould. 4. Sampling and Mixing of Concrete Sample concrete from freshly mixed batch. Mix thoroughly until uniform colour and consistency are achieved. Start casting immediately to avoid loss of workability. 5. Casting of Concrete Cubes Fill mould in three equal layers. Distribute concrete evenly around mould. 6. Compaction of Concrete Compact each layer by rodding or vibration. Manual compaction: 35 strokes per layer. Rods to penetrate into the previous layer. Tap mould sides gently to remove air voids. Finish top surface smoothly using trowel. 7. Identification and Initial Storage Date of casting Grade of concrete Cube number / location Store cubes undisturbed for 24 hours at 27 ± 2°C. 8. Curing of Concrete Cubes Demould cubes after 24 ± ½ hours. Immediately immerse in clean water. Maintain curing temperature at 27 ± 2°C. Continue curing till testing age. 9. Compression Testing of Cubes (IS:516) Remove cube from curing tank (SSD condition). Clean cube and CTM platens. Measure dimensions (nearest 0.2 mm). Place cube centrally on CTM platen. Apply load gradually at ≈140 kg/cm²/min. Record maximum load at failure. Note: Improper centring causes eccentric loading and wrong test results. 10. Calculation of Compressive Strength Compressive Strength (N/mm²) = Maximum Load at Failure ÷ Loaded Area 11. Cube Size – Area – Thumb Rules Cube Size Loaded Area 150 mm Cube 225 cm² 100 mm Cube 100 cm² Fast Site Calculation Rules 150 mm cube → Load (kg) ÷ 225 | Load (kN) ÷ 22.5 100 mm cube → Load (kg) ÷ 100 | Load (kN) × 10 12. Sampling Frequency (IS Practice – Simplified) Concrete Quantity No. of Samples Total Cubes 1 – 5 m³ 1 3 6 – 15 m³ 2 6 16 – 30 m³ 3 9 31 – 50 m³ 4 12 Each additional 50 m³ +1 +3 13. Reporting of Results Calculate strength of each cube. Round off to nearest whole number. Average of 3 cubes = representative strength. Variation limits must be satisfied. Concrete Strength Acceptance Criteria (±15% Rule Explained) Basic Rule For any set of 3 cubes (one sample): Calculate average strength Each cube must lie within: 0.85 × Average (−15%) 1.15 × Average (+15%) If even one cube is outside this range, the sample is REJECTED, irrespective of average strength. Key Strength Values – M25 Concrete Characteristic strength (fck) = 25 N/mm² Standard deviation (assumed) = 4 N/mm² Target mean strength = fck + 1.65 × S = 25 + (1.65 × 4) = 31.6 N/mm² CASE–1: Single Sample (Small Quantity Concrete) Concrete Quantity = 5 m³ As per IS practice → 1 sample (3 cubes) Acceptance Criterion (Special Case) When only one sample is available: Average strength ≥ fck + 4 = 29 N/mm² Cube Strengths (N/mm²) Average 0.85 × Avg 1.15 × Avg 19, 26, 16 20.3 17.3 23.3 Reasons for Rejection ❌ Average strength less than 29 N/mm² ❌ Cubes 26 and 16 N/mm² outside ±15% range Final Decision: ❌ CONCRETE REJECTED CASE–2: Multiple Samples (Normal Quantity Concrete) Concrete Quantity = 28 m³ Samples required = 3 samples (9 cubes) Acceptance Criteria Each cube ≥ fck − 2 = 23 N/mm² Overall average ≥ fck + 4 = 29 N/mm² ±15% variation satisfied for each sample Sample-wise Results Sample Cube Strengths (N/mm²) Average 0.85 × Avg 1.15 × Avg 1 33, 29, 32 31.3 26.6 36.0 2 24, 32, 28 28.0 23.8 32.2 3 25, 29, 32 28.7 24.4 33.0 Overall Average Strength (31.3 + 28.0 + 28.7) ÷ 3 = 29.3 N/mm² Acceptance Check (As per IS Acceptance Criteria) ✅ ±15% Variation Check: All individual cube strengths fall within the permissible range of 0.85 × Average to 1.15 × Average for their respective samples. This confirms uniformity in batching, mixing, compaction, and curing of concrete. ✅ Minimum Individual Strength Check: Each tested cube has achieved a compressive strength greater than or equal to fck − 2, i.e. 23 N/mm² for M25 concrete. No cube strength is below the minimum permissible limit. ✅ Average Strength Check: The overall average compressive strength of all samples is 29 N/mm² or higher, which satisfies the requirement of fck + 4 for acceptance of concrete under normal sampling conditions. ✅ Quality and Compliance Confirmation: Since variation, individual strength, and average strength criteria are all satisfied, the concrete meets the

Compressive Strength of Cube Read More »

Profile Corrective Course DBM

Profile Corrective Course (DBM) Construction Methodology | MoRTH Profile Corrective Course (Dense Bituminous Macadam) – Construction Methodology Profile Corrective Course (PCC) using Dense Bituminous Macadam (DBM) is executed to correct pavement profile irregularities such as depressions, sags, uneven camber and surface undulations before laying the final overlay. 1.0 Scope and Surface Preparation The Profile Corrective Course is a bituminous layer of variable thickness (typically 50–100 mm) laid over an existing granular or bituminous surface to restore the correct longitudinal and cross profile as per approved drawings. 1.1 Existing Bituminous Surface Repairs: Potholes, cracks and distressed areas shall be repaired as per MoRTH Clauses 3004.2 & 3004.3. Scarifying: Where specified, existing bituminous layer shall be scarified without disturbing underlying layers. Base Preparation: Exposed surface reworked, compacted and primed if required as per Clause 502. Tack Coat: Bituminous emulsion applied uniformly before laying PCC DBM. 1.2 Existing Granular Surface Surface cleaned of loose material and dust. Priming carried out as per MoRTH Clause 502 before bituminous layer. Surface to be firm, dry and broom-cleaned. 1.3 Pre-Laying Checks Existing top levels shall be jointly checked and recorded before and after preparation to confirm thickness and profile correction. 2.0 Plant, Machinery & Equipment Sl. No. Equipment Quantity 1 Batch Type Hot Mix Plant (200 TPH) 01 2 Sensor Paver with Auto Screed Control 01 3 Pneumatic Tyred Roller 01 4 Tandem Vibratory Roller 02 5 Bitumen Sprayer 01 6 Hydraulic Broom / Air Compressor 01 7 Water Tanker 01 8 Tipping Trucks As required 3.0 Materials & Mix Production 3.1 Materials Coarse & fine aggregates from approved quarries Bitumen: VG-30 / VG-40 (IS:73) Tack Coat: Rapid setting bituminous emulsion 3.2 Job Mix Formula (JMF) JMF shall be prepared in the site laboratory using Marshall Method and approved by IE/PMC. The procedure is identical to DBM/BC mix design as per MoRTH Section 500. 3.3 Hot Mix Plant Operation Bitumen storage temperature: 150–165°C Aggregate drying temperature: 150–170°C Mixing carried out in controlled, dust-free environment Maximum mix temperature not exceeding 165°C 4.0 Laying & Compaction 4.1 Transportation of Mix Mix transported in covered tipping trucks. Truck beds coated with release agent. Mix temperature at dispatch: 155–165°C. 4.2 Tack Coat Application Rate of application: 0.25–0.30 kg/m² Applied by mechanical sprayer DBM laid only after tack coat breaks 4.3 Laying & Finishing Sensor wire fixed at 10 m interval for profile control Minimum laying temperature: 125°C Loose thickness allowance: approx. 25% Manual laying permitted in confined areas 4.4 Compaction Rolling by vibratory roller followed by PTR Rolling from lower edge to higher edge Compaction continued until specified density achieved Joints cut full depth and edges painted with hot bitumen 5.0 Quality Control & Traffic Management Core cutting after 24 hours for density verification Routine bitumen testing for each consignment Surface finish as per MoRTH Clause 902 Traffic opened minimum 24 hours after completion Traffic managed using cones, barricades and flagmen Frequently Asked Questions – PCC DBM What is PCC? A corrective bituminous layer to restore pavement profile. Typical thickness? 50–100 mm per layer. Where used? Depressions, sags, uneven camber. Material used? DBM with VG-30/VG-40 bitumen. Surface preparation? Repair, scarify, clean, prime/tack. Compaction? Vibratory roller + PTR. Joint treatment? Full-depth cut with hot bitumen coating. Traffic opening? After minimum 24 hours. 🏗️ Highway Construction Methodology Hub Standard construction methodologies for highway works as per MoRTH 5th Revision and IRC Specifications. ✅ Earthwork Methodology ✅ Clearing & Grubbing Methodology ➡️ ✅ Embankment Construction Methodology ➡️ ✅ Flyash Embankment Construction Methodology ➡️ ✅ Subgrade Construction Methodology ➡️ ✅ Granular Work Methodology ✅ Granular Sub-Base (GSB) Methodology ➡️ ✅ Wet Mix Macadam (WMM) Methodology ➡️ ✅ Bituminous Work Methodology ✅ Prime Coat Application Methodology ➡️ ✅ Tack Coat Application Methodology ➡️ ✅ Dense Bituminous Macadam (DBM) Methodology ➡️ ✅ Bituminous Concrete (BC) Methodology ➡️ ✅ Profile Corrective Course of DBM ➡️ ✅ Use of Waste Plastic in Bitumen ➡️ ✅ Use of Waste Plastic in Road Construction ➡️ ✅ Thermoplastic Road Marking Methodology ➡️ ✅ Concrete Methodology ✅ Dry Lean Concrete (DLC) Methodology ➡️ ✅ PQC Road Construction Methodology ➡️ ✅ Kerb Construction Methodology ➡️

Profile Corrective Course DBM Read More »

Scroll to Top