
Final Setting Time of Cement
Final setting time is the time taken by cement paste to completely lose plasticity and attain hardness. As per IS 4031, it should not exceed 600 minutes for OPC.
Final Setting Time of Cement Read More »
Concrete Work
Precision Testing. Proven Quality. Safer Infrastructure.
Final setting time is the time taken by cement paste to completely lose plasticity and attain hardness. As per IS 4031, it should not exceed 600 minutes for OPC.
Final Setting Time of Cement Read More »
Concrete Work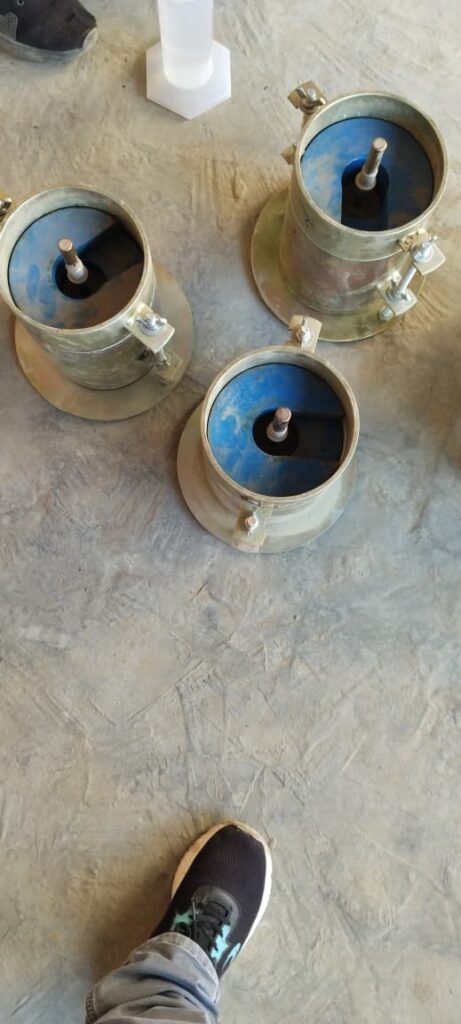
The CBR test evaluates the strength of subgrade soil, sub-base, or base course material under controlled compaction and moisture conditions. The value obtained is used in pavement thickness design.
California Bearing Ratio Test Read More »
Soil
Compressive Strength Test of Cement Mortar Cubes – IS 4031 (Part 6) | Step-by-Step with Examples Compressive Strength Test of Cement Mortar Cubes (IS: 4031 – Part 6) Quick Summary: IS:4031 (Part-6) specifies the method for determination of compressive strength of cement using standard mortar cubes of size 70.6 mm. Cubes are prepared in a 1:3 cement–standard sand mix, compacted by vibration, cured for 3, 7 and 28 days, and tested at a loading rate of 35 N/mm²/min. The test ensures that cement meets the minimum strength requirements prescribed for OPC-43 and OPC-53 grades. Example: This test is used to check whether an OPC 43 or OPC 53 cement bag supplied to site meets BIS strength requirements at 3, 7 and 28 days. 1. Intoduction: To determine the compressive strength of hydraulic cement, standard cement mortar cubes (70.6 mm size) are cast and compacted using a standard vibration machine as per IS 4031 (Part 6). This Compressive Strength Test ensures cement quality by covering cube casting, curing, testing, calculation, and result interpretation, making it field-ready for engineers and QA/QC teams to ensure reliable concrete performance in highway and structural applications. 2. Apparatus Vibration machine (12,000 ± 400 vibrations/min) Cube moulds – 70.6 mm × 70.6 mm × 70.6 mm Standard sand (IS 650 : 1966) Prodding rod Non-porous mixing plate Weighing balance Cube crushing testing machine (CTM) Mould oil, petroleum jelly Potable / distilled water Example: If your CTM capacity is 2000 kN and vibration machine speed is calibrated annually, the setup satisfies IS requirements. 3. Standard Sand (IS 650) Particle Size Range Percentage 2.0 mm – 1.0 mm 33.33% 1.0 mm – 500 micron 33.33% 500 micron – 90 micron 33.33% Example: If 900 g of standard sand is tested for gradation, each fraction should weigh approximately 300 g. 4. Mix Proportion Material Quantity Cement 200 g Standard Sand 600 g Water (P/4 + 3)% P = % water required for standard consistency (IS 4031 Part 4) Example: If standard consistency P = 26% Water = (26/4 + 3)% = 9.5% Total mass = 800 g Water = 0.095 × 800 = 76 g 5. Mixing Procedure Dry mix cement + sand for 1 minute. Add calculated water. Mix for minimum 3 minutes. Reject mix if uniform colour is not achieved within 4 minutes. Example: Dry mixing from 10:00–10:01 AM Wet mixing ends at 10:04 AM → ACCEPTABLE If mixing continues beyond 10:05 AM → REJECT batch 6. Moulding of Specimens Oil mould and base plate. Fix mould firmly on vibration table. Fill mortar in layers. Prod each layer 20 times in ~8 seconds. Vibrate for 2 minutes. Finish surface using trowel. Example: 1st layer: 20 rod blows in 8 s 2nd layer: 20 rod blows in 8 s Vibration time: 2 minutes exactly 7. Curing of Specimens Keep moulds in moist room for 24 hours. Demould and immerse in water. Maintain water temperature at 27 ± 2°C. Renew water every 7 days. Example: Casting completed at 4 PM on Day-0 Demould at 4 PM on Day-1 3-day test conducted at 4 PM on Day-3 8. Testing of Specimens Test cubes on their sides. Load rate: 35 N/mm² per minute. Test minimum three cubes. Example: For cube area 50 cm² (=5000 mm²), Load rate ≈ 175 kN per minute 9. Calculation of Compressive Strength Compressive Strength = P / A Example (kg-machine): Crushing load = 7200 kg Area = 50 cm² Strength = 7200 / 50 = 144 kg/cm² Example (kN-machine): Load = 720 kN Equivalent load = 720 × 101.97 = 73418 kg Strength = 73418 / 50 = 1468 kg/cm² 10. Minimum Strength Requirements OPC 43 Grade Cement Age Strength (MPa) kg/cm² 3 Days 23 235 7 Days 33 337 28 Days 43 438 OPC 53 Grade Cement Age Strength (MPa) kg/cm² 3 Days 27 275 7 Days 37 377 28 Days 53 540 ⬇ Download Cement Mortar Cube Test – Excel Sheet Top 10 FAQs – Compressive Strength of Cement What is the compressive strength of cement? It is the maximum load per unit area that a cement mortar cube can withstand under compression. Which IS code governs the compressive strength test of cement? IS:4031 (Part-6) specifies the procedure for determination of compressive strength of cement. Why is standard sand used in cement strength testing? Standard sand (IS:650) ensures uniform grading and repeatable test results. What is the size of cement mortar cube? Standard cube size is 70.6 mm × 70.6 mm × 70.6 mm with a cross-sectional area of 50 cm². What is the mix proportion for cement mortar cubes? Cement : Standard Sand = 1 : 3 by weight. How is water quantity calculated? Water = (P/4 + 3)% of the combined weight of cement and sand, where P is the standard consistency. What are standard curing periods? Cement mortar cubes are tested at 3 days, 7 days, and 28 days. What is the required compressive strength for OPC cement? OPC-43: 23, 33, 43 MPa and OPC-53: 27, 37, 53 MPa at 3, 7, and 28 days respectively. How is compressive strength calculated? Strength (kg/cm²) = Crushing Load (kg) / Area (cm²). Can a compression testing machine display load in kN? Yes. Load in kN must be converted into kg before calculating strength. Prepared by Kishor Kumar | Source: HighwayQualityTest.com Standard Reference: IS 4031 (Part 6) – Methods of Physical Tests for Hydraulic Cement (BIS). Quick Reference: Compressive Strength of Cement (IS:4031 Part-6) Test Objective: Determine compressive strength of standard cement mortar cubes Specimen Size: 70.6 mm × 70.6 mm cube (area = 50 cm²) Mix Proportion: Cement : Standard Sand = 1 : 3 by weight Quantity per Cube Set: Cement = 200 g, Sand = 600 g Water Content: (P/4 + 3)% of combined mass of cement and sand Standard Sand: Conforming to IS:650 (100% passing 2 mm, retained on 90 micron) Compaction: Vibration for 2 minutes @ 12,000 ± 400 vibrations/min Curing Periods: 3 days, 7 days & 28 days
Compressive Strength of Cement Read More »
Cement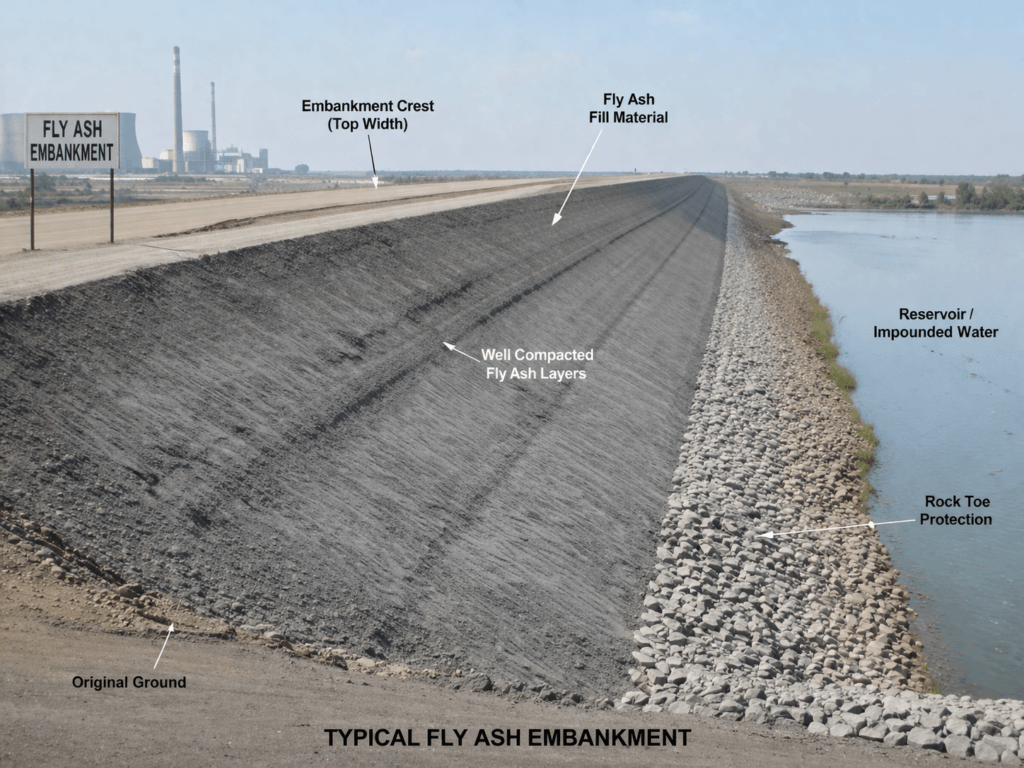
This work is governed by IRC: SP: 58-2001 and MoRT&H Specifications for earthen embankments. The core principle is the simultaneous placement and compaction of the fly ash core and the required earth cover.
Fly Ash Embankment Construction Methodology (IRC:SP:58-2001) Read More »
Earthwork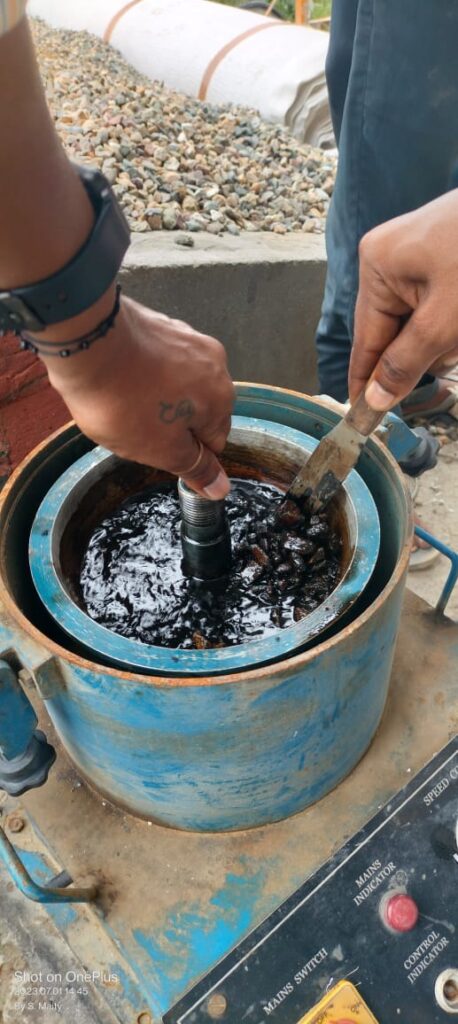
Bitumen is a viscous, black, sticky, and highly cementitious substance derived from crude petroleum through a refining process. It is primarily composed of hydrocarbons and their derivatives. Often referred to as asphalt cement in North America, bitumen is best known for its use as the binding agent in asphalt concrete for road construction, paving, and roofing applications.
________________________________________
What is Bitumen? Grade, Types, Properties Read More »
Bitumen
Road marking is a critical aspect of highway and urban road safety, providing visual guidance to drivers and pedestrians. Learn about types of road markings, their functions, materials used, and standards for durable, visible markings on pavements.
Road Marking Methodology | Thermoplastic, Paint & Safety Standards Guide Read More »
MiscellaneousPavement Quality Concrete (PQC) M40 – Complete Construction & QA/QC Guide Pavement Quality Concrete (PQC) M40: Complete Construction & QA/QC Guide 1. General Overview Pavement Quality Concrete (PQC) is the final structural layer of rigid pavement designed to directly carry traffic loads and distribute them safely to underlying layers. It is a high-strength cement concrete layer constructed over DLC/WMM/GSB as per approved drawings and MoRTH specifications. The success of PQC depends on strict control of: Sub-base readiness (DLC/WMM quality) Concrete mix design and production control Continuous paving without interruption Proper vibration, finishing, and leveling Joint construction and curing discipline Applicable Standards Reference Documents S. No. Document Description 1 Contract Agreement 2 IRC: SP: 84-2014 3 Ministry of Road Transport & Highways Specifications (MoRTH – 5th Revision) 4 Relevant Drawings 2. Pre-Construction Requirements Pavement Quality Concrete (PQC) shall be executed only after ensuring that all pre-construction conditions are satisfied as per MoRTH and approved project specifications. 2.1 Base Layer Approval (DLC / GSB) PQC shall not be laid until the underlying layer is fully approved by the Engineer. Formation / DLC / GSB must be properly compacted Surface shall be true to line, level, and cross fall Free from loose soil, dust, and contamination Field Density Test (FDT) results must be approved Surface shall be thoroughly cleaned before PQC laying Strong Base = Long Life Pavement. Any weakness in DLC/GSB directly affects PQC performance. 2.2 Plant & Equipment Approval The following equipment must be deployed, tested, and approved before PQC execution: Fully calibrated concrete batching plant Transit mixers / dumpers in adequate quantity Needle vibrators (minimum 2 per paving team) Screed vibrator / slip form paving machine (sensor paver preferred) Water tanker for curing operations 3 m straight edge and leveling instruments Concrete saw cutting machine for joint cutting 3. Survey, Setting Out & String Line Control Accurate survey control is essential for achieving correct alignment, level, and riding quality of PQC pavement. 3.1 Control Points Center line established using Total Station Edge lines marked as per approved drawings Formation levels transferred from GFC drawings Benchmarks shall be protected throughout construction 3.2 Level Control System String line system used for fixed form paving Automatic sensor control system used for slip form paving Level pegs installed at specified intervals 👉 Even a small level deviation at this stage directly affects pavement smoothness and riding quality. 4. Concrete Mix Design & Production 4.1 Mix Design Requirements Concrete mix shall be designed as per approved design mix (generally M40/M35 or as specified in contract). Design as per IS 10262 and MoRTH Clause 602 Minimum cement content as per specification requirements Strict control of water-cement ratio Use of approved admixtures for workability and setting control 4.2 Batching Plant Operations Batching plant shall be fully calibrated before start of work Moisture correction in aggregates is mandatory daily Weigh batching system only (volume batching strictly prohibited) Uniform mixing time shall be maintained for every batch Mix consistency shall be checked regularly Consistent batching = Consistent strength. Any variation in batching directly affects flexural strength of PQC. 5. Transportation of Concrete Concrete shall be transported using transit mixers only Segregation of concrete during transport shall be strictly avoided No delay beyond initial setting time is permitted Concrete shall be discharged immediately at site Site Slump Control Slump shall be checked at site for every batch Typical range: 30 – 60 mm (as per design requirement) No water shall be added at site without Engineer approval Any delay or re-tempering of concrete at site will lead to rejection of the batch. 6. Laying of PQC (Execution Control: From QA/QC point of view, PQC laying is not just a construction activity but a controlled engineering process where time, vibration, placement, and finishing directly govern the structural performance and service life of the pavement. Strict supervision, continuous monitoring, and zero-tolerance control are required during this stage. 6.1 Placement Control : Concrete placement shall be executed in a continuous and uninterrupted operation to ensure structural integrity of PQC slabs. Placement shall be continuous without stoppage under normal conditions Cold joints are strictly prohibited in PQC construction Concrete shall not be rehandled, remixed, or re-tempered at site Concrete shall be discharged ahead of the paving machine in a controlled and uniform manner From QA/QC perspective: Any interruption in placement leads to weak planes, reduced load transfer efficiency, and early pavement distress. 6.2 Compaction Control (Critical QA/QC Activity) Compaction is the most sensitive operation in PQC construction and must be strictly monitored by QA/QC engineers during execution. Internal needle vibrators shall be used uniformly across the full slab width Vibration pattern shall follow systematic overlapping to avoid un-compacted zones Vibrators shall be inserted vertically and withdrawn slowly to ensure full densification Over-vibration must be strictly avoided to prevent segregation and bleeding of cement slurry 👉 QA/QC Insight: Proper compaction ensures homogeneous density, high flexural strength, and long-term pavement durability. Improper vibration is a primary cause of honeycombing and premature failures. 6.3 Finishing Control (Surface Quality Requirement) Finishing operations directly define the riding quality, skid resistance, and service performance of the pavement and therefore require strict QA/QC supervision. Screeding shall be carried out immediately after completion of compaction Surface shall be finished to required line, level, and cross fall as per drawings Floating shall be done to achieve uniform surface texture and smoothness Edge correction shall be carried out manually wherever required with full control From HOP perspective: Final finishing determines client acceptance. Even minor surface irregularities can lead to rejection or grinding requirement. 7. Surface Texturing Surface texturing in Pavement Quality Concrete (PQC) is a critical finishing operation carried out to ensure adequate skid resistance, safe vehicular movement, and long-term riding performance of the pavement surface. From a QA/QC and Head of Project perspective, texturing is directly linked with road safety, surface performance, and client acceptance. 7.1 Purpose of Surface Texturing To provide adequate skid resistance for moving traffic To improve braking performance and safety under wet conditions To ensure uniform surface roughness
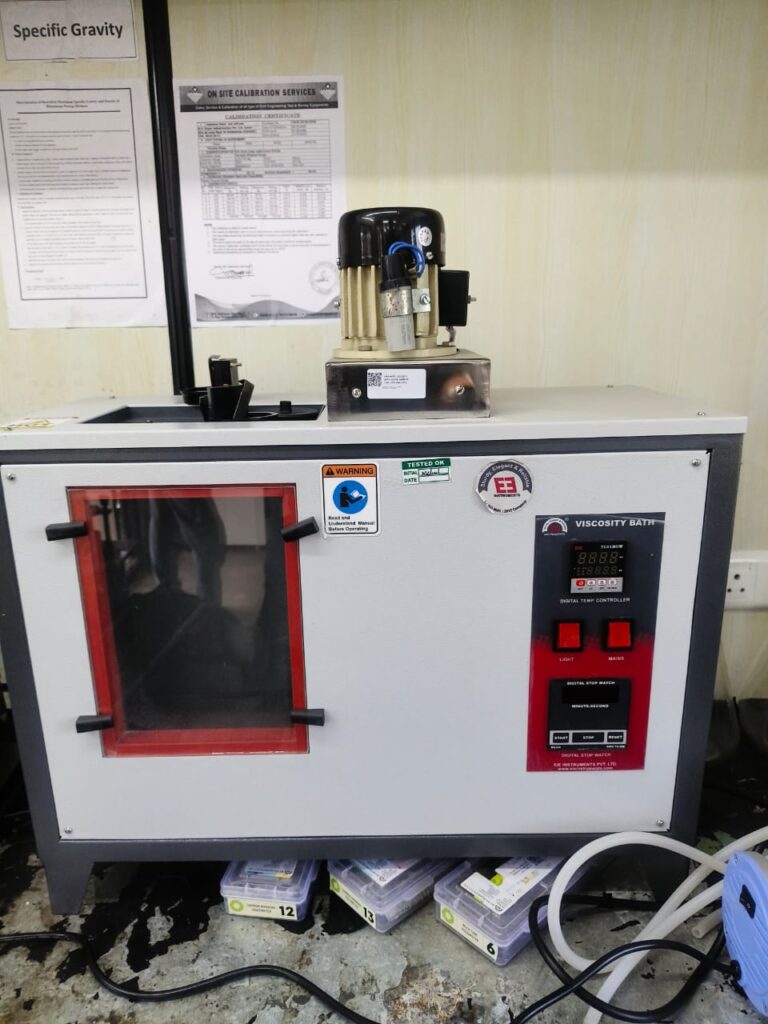
Absolute Viscosity Test of Bitumen – ASTM D2171 Procedure & Calculation Absolute Viscosity Test of Bitumen Using Cannon-Manning Vacuum Capillary Viscometer (ASTM D2171) The Absolute Viscosity Test of Bitumen is a critical laboratory procedure used to assess the flow characteristics of paving-grade bitumen under controlled temperature and vacuum conditions. This test is essential for highway engineers, laboratory technicians, and quality control professionals who need accurate and reproducible data on bitumen viscosity. Using a Cannon-Manning Vacuum Capillary Viscometer, the test measures the time it takes for a bitumen sample to flow through a capillary tube, which is then converted into absolute viscosity using a calibrated factor. Performing this test correctly ensures that the selected bitumen will perform effectively under traffic loads and varying climatic conditions. 1. OBJECTIVE The main goal of this test is to determine the absolute viscosity of bitumen at a standard temperature of 60 °C under a vacuum of 30 cm Hg. Viscosity measurement is critical for: Ensuring proper workability of asphalt during mixing and laying. Predicting rutting and deformation resistance of pavement. Verifying consistency and quality of paving-grade bitumen. Comparing bitumen from different suppliers. 2. THEORY Bitumen is a viscoelastic material, meaning its resistance to flow depends on temperature and load. The absolute viscosity represents its internal resistance to flow under laminar conditions. The Cannon-Manning Vacuum Capillary Viscometer determines this property by: Allowing bitumen to flow through a narrow capillary under vacuum. Recording the flow time between two calibrated marks. Multiplying the flow time with the viscometer’s calibration factor (K) to calculate viscosity in Poises. Using a vacuum helps remove air bubbles and ensures smooth laminar flow, which is essential for accurate results. The ASTM D2171 standard ensures consistency and repeatability in viscosity measurements across different laboratories and projects. 3. APPARATUS Constant Temperature Bath (water up to 100 °C or silicone oil up to 150 °C) with ±0.1 °C accuracy. Vacuum pump and manometer capable of maintaining 30 cm Hg with ±0.05 cm Hg accuracy. Cannon-Manning Vacuum Capillary Viscometer (Size 12 or 13 depending on bitumen grade). Stopwatch with 0.5-second accuracy. Viscometer stand for holding up to 6 tubes. Thermometer for monitoring sample and bath temperature. Glassware and safety equipment such as tongs, gloves, and goggles. Note: All apparatus should be clean, dry, and calibrated according to the manufacturer’s specifications to ensure accurate measurements. 4. PROCEDURE Sample Collection: Collect a representative bitumen sample (~50 g) in a clean container and stir gently to ensure homogeneity. Heating: Heat the sample to 135 ± 5.5 °C using a water or silicone oil bath. Avoid overheating to prevent oxidation of bitumen. Filling Viscometer: Carefully pour the heated bitumen into the viscometer up to the fill mark (Line E ±2 mm). Standing Period: Let the viscometer stand for 10 ± 2 minutes to allow trapped air bubbles to escape. Immersion in Bath: Place the viscometer in the constant temperature bath maintained at 60 °C. Ensure it is suspended and does not touch the bottom of the bath. Vacuum Application: Connect the viscometer to the vacuum pump and apply 30 cm Hg vacuum. Verify the reading on the manometer. Timing Flow: Start the stopwatch as the bitumen reaches Mark G and stop when it reaches Mark H. Record the flow time (T seconds). Repeat: Perform at least three measurements per sample and calculate the average flow time for accuracy. Tips for Accuracy: Avoid shaking the viscometer, maintain bath temperature ±0.1 °C, and ensure a stable vacuum during the test. 5. CALCULATION Formula for Absolute Viscosity Absolute Viscosity (Poises) = K × T K: Calibration factor of viscometer in Poises/sec (provided by the manufacturer). T: Flow time in seconds from Mark G to Mark H. Example: If T = 250 s and K = 12.5 Poises/sec, then Absolute Viscosity = 12.5 × 250 = 3125 Poises. 6. RESULTS The results should be reported as follows: Sample identification Bath temperature (60 °C) Vacuum applied (30 cm Hg) Flow time (T seconds) Calculated absolute viscosity (Poises) Observations (e.g., bubbles, irregular flow) Sample Temp (°C) Vacuum (cm Hg) Flow Time T (s) Absolute Viscosity (Poises) Bitumen A 60 30 250 3125 Bitumen B 60 30 200 2500 7. FACTORS AFFECTING VISCOSITY Temperature: Viscosity decreases with increasing temperature. Vacuum Accuracy: Inconsistent vacuum affects flow time. Air Bubbles: Entrapped air lowers measured viscosity. Viscometer Calibration: Must match the size and grade of bitumen. Bitumen Grade: Penetration grade and polymer-modified bitumen differ in viscosity. 8. TROUBLESHOOTING Problem Possible Cause Solution Erratic flow Air bubbles trapped in viscometer Let bitumen stand longer or reheat gently Slow flow Sample too viscous or too cold Ensure bath temperature is correct and bitumen is properly heated Vacuum drops Leaks in tubing or joints Inspect vacuum system and seal leaks Temperature fluctuates Faulty thermostat Use calibrated bath and monitor continuously Quick Reference: Absolute Viscosity Test (ASTM D2171) Standard: ASTM D2171 – Viscosity by Vacuum Capillary Viscometer Purpose: Measure flow resistance of bitumen at 60°C under vacuum Vacuum: 30 cm Hg (±0.05 cm Hg) Test Temperature: 60°C (accuracy ±0.1°C) Viscometer: Cannon-Manning (Size 12/13) Sample Heating: 135 ±5.5 °C before filling Flow Timing: Between Mark G → H Viscosity Formula: Absolute Viscosity = K × T Top FAQs – Absolute Viscosity Test of Bitumen (ASTM D2171) What is the Absolute Viscosity Test? It determines bitumen’s resistance to flow at 60°C using a vacuum capillary viscometer under 30 cm Hg vacuum, providing reliable QC data. Why is vacuum used? To remove air bubbles and ensure laminar flow, reducing measurement errors. Which viscometer is used? Cannon-Manning Vacuum Capillary Viscometer, typically Size 12 for paving grades. What is the test temperature? 60°C ±0.1°C to simulate typical bitumen service temperature. How is viscosity calculated? Viscosity = K × T, where K is the calibration factor and T is flow time in seconds. Minimum heating temperature? 135 ±5.5°C to ensure proper flow and eliminate lumps. Standing time after filling? 10 ±2 minutes to allow air bubbles to escape. Precision for timing? Stopwatch accurate to ±0.5 sec for reliable results. Typical viscosity values? 800–4000 Poises at 60°C for paving bitumen. Why 60°C? Reflects bitumen’s
Absolute Viscosity Test of Bitumen as per ASTM D2171 Read More »
Bitumen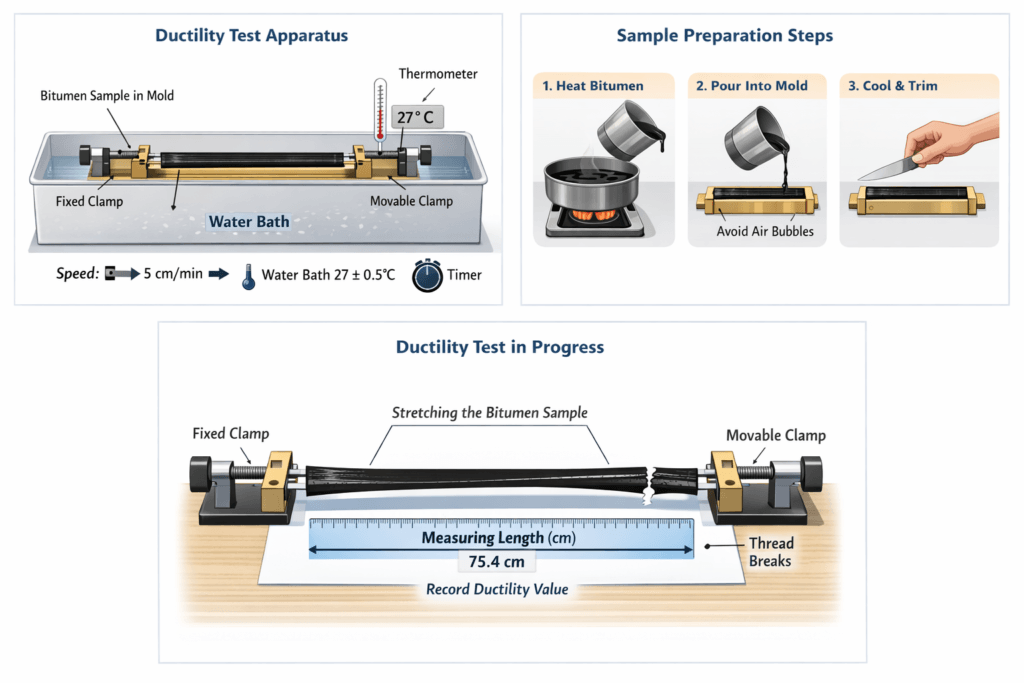
Ductility Test of Bitumen – IS 1208 Procedure, Apparatus & Results Ductility Test of Bitumen – IS 1208 Complete Guide The ductility test measures the stretching capacity of bitumen under tensile load before failure. It is a key parameter for evaluating flexibility and crack resistance in flexible pavements. Fig: Ductility test process flow Objective To determine the ductility of bituminous material i.e. its ability to stretch without breaking under standard test conditions. Apparatus Required Ductility testing machine Briquette mould Water bath (temperature controlled) Thermometer Hot knife / spatula Fig: Briquette mould assembly Sample Preparation Heat the bituminous material until it becomes completely fluid. Filter the molten bitumen through a 90-micron sieve to remove impurities. Assemble the briquette mould on a clean brass plate. Coat the brass plate and inner surfaces of the mould with a mixture of equal parts glycerine and dextrine to prevent sticking. Pour the molten bitumen slowly in a thin continuous stream from end to end of the mould until slightly overfilled. Allow the specimen to cool at room temperature for 30–40 minutes. Place the mould assembly in a water bath maintained at the specified temperature for 30 minutes. Level the surface using a hot straight-edged knife or spatula to make the mould exactly flush. Procedure (IS Standard Method) Step 1 – Standard Test Conditions Unless otherwise specified, the ductility test shall be conducted at a temperature of 25.0 ± 0.5°C and at a pulling rate of 50.0 ± 2.5 mm/min. Step 2 – Low Temperature Ductility Test When low-temperature ductility is required, the test shall be performed at 4.0 ± 0.5°C with a pulling rate of 10.0 ± 0.5 mm/min. Step 3 – Mould Conditioning Place the brass plate with mould and sample in a water bath maintained at the specified temperature. Keep it for 85–95 minutes for proper conditioning before testing. Step 4 – Specimen Preparation Remove the briquette carefully from the water bath and detach the side plates without disturbing the specimen. Step 5 – Mounting in Machine Immediately fix the specimen in the ductility testing machine by attaching the clips without applying any initial strain. Step 6 – Test Execution Pull the two clips horizontally at a uniform rate of 50 ± 2.5 mm/min until rupture occurs. Step 7 – Test Conditions Control Ensure the specimen remains fully submerged in water during the test. Water level must be at least 25 mm above and below the specimen, and temperature must remain within ±0.5°C. Result The ductility value is the distance in centimeters through which the bitumen thread stretches before breaking. Interpretation of Results High ductility: Indicates flexible, durable, and crack-resistant pavement performance. Low ductility: Indicates brittle bitumen with higher risk of pavement cracking. Limits of Ductility A35 & S35 grade bitumen: Minimum 50 cm at 27°C Other paving grades: Minimum 75 cm at 27°C Importance Ensures pavement flexibility Prevents thermal cracking Improves service life Essential for QA/QC testing Conclusion Ductility test ensures bitumen has sufficient elongation capacity to withstand traffic loads and temperature variations in highway construction. Precautions 1. If the bituminous material comes in contact with the surface of water or touches the bottom of the water bath during the test, the result shall not be considered normal. In such cases, the specific gravity of the water in the bath shall be adjusted by adding either methyl alcohol or sodium chloride, so that the bituminous material neither floats on the surface nor touches the bottom of the bath at any time during the test. 2. The plate on which the mould is placed shall be perfectly flat and level so that the bottom surface of the mould remains in full contact throughout the test. 3. While filling the mould, care shall be taken not to disturb the mould assembly, as this may distort the briquette. It shall also be ensured that no air pockets are trapped within the moulded specimen. 4. If a normal test result is not obtainable in three successive attempts, the ductility shall be reported as “unobtainable under the conditions of test.” FAQs What does ductility indicate? It indicates the ability of bitumen to stretch without breaking. Why is ductility important? It prevents cracking and improves pavement flexibility. Standard temperature? 25–27°C as per IS 1208. How is ductility measured? In centimeters of elongation before rupture. HIGHWAY QUALITY TEST Download Ductility Test of Bitumen Excel Format Prepare professional Ductility Test of Bitumen reports in minutes using our ready-to-use Excel format with automatic calculations. Accurately determine the ductility value of bitumen using the standard Ductility Test Method while eliminating manual calculation errors and generating laboratory-ready reports instantly. 💰 Only ₹99 One-Time Payment • Instant Access • Lifetime Access 🛒 Buy Ductility Test of Bitumen Excel Format ✔ Secure Payment | ✔ Instant Download | ✔ Editable Excel
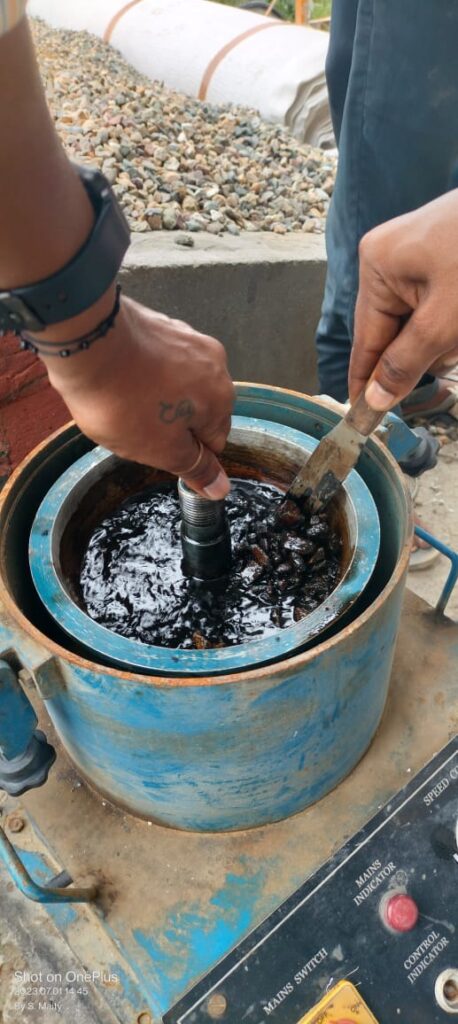
The Bitumen Extraction Test is a laboratory method used to determine the actual bitumen content present in a bituminous mix by separating the binder from aggregates using a suitable solvent. This test is essential for quality control, mix design verification, and compliance with MoRTH / IS:2720 (Part 2) and ASTM standards. Accurate bitumen content ensures proper pavement durability, strength, and resistance to deformation.
Bitumen Extraction Test – Objective, Procedure & Calculation Read More »
Bitumen, Bituminous Work