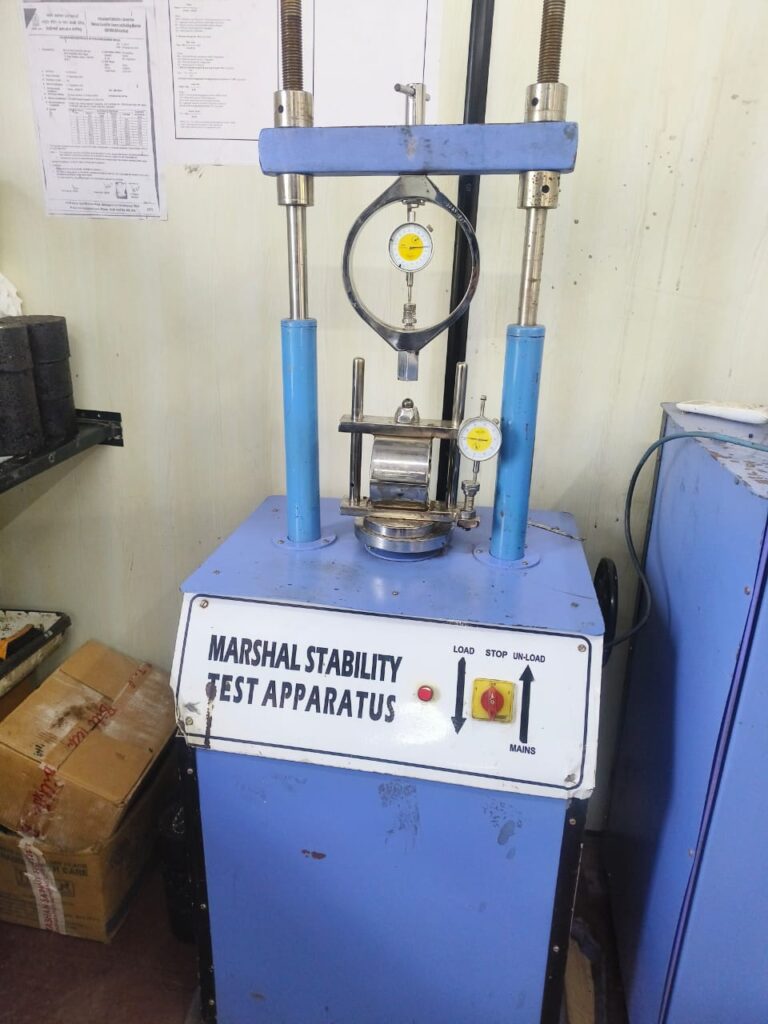
Marshall Stability Test with Mould Casting
The Marshall Stability Test remains the backbone of bituminous mix evaluation under MoRTH guidelines. It provides vital information on:Strength (Stability), Deformation (Flow), Density, Air voids,VMA, VFB
The Marshall Stability Test remains the backbone of bituminous mix evaluation under MoRTH guidelines. It provides vital information on:Strength (Stability), Deformation (Flow), Density, Air voids,VMA, VFB
The work shall consist of construction of dry lean concrete subbase forcement concrete pavement in accordance with the requirements of these specificationsand in conformity with the lines,
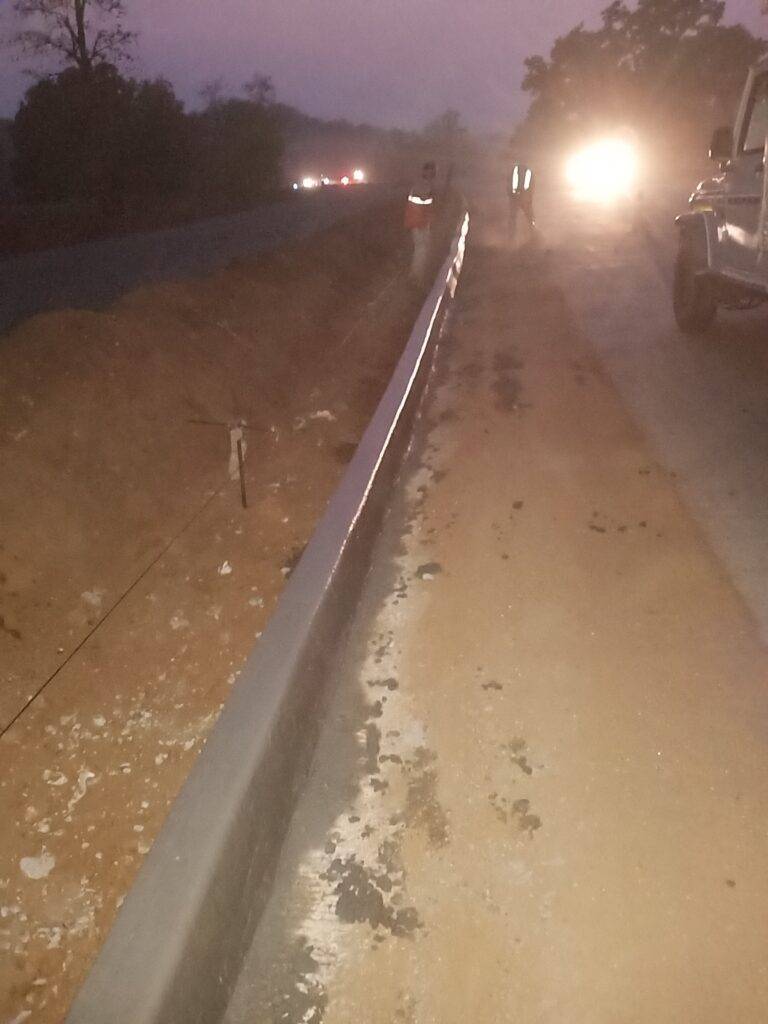
This method statement covers construction of cement concrete kerbs in central medians, footpaths and separators in accordance with project drawings and applicable codes.
Water Absorption Test of Coarse Aggregate — Objective, Procedure & Calculation Water Absorption Test of Coarse Aggregate The Water Absorption Test determines the percentage of water absorbed by coarse aggregates, providing an indication of pore structure, density, and suitability for high-quality concrete and asphalt works. Objective To determine the Water Absorption (%) of a coarse aggregate sample using SSD and Oven-dry mass values. Apparatus Required Tray or suitable container Balance (Capacity ≥ 3 kg, Accuracy 0.5 g) Oven (100–110°C) Cotton cloth Test Procedure 1. Immersion (Saturation) Take at least 2000 g (2 kg) of aggregate. Immerse in clean water for 24 hours to fill internal pores. 2. Saturated Surface Dry (SSD) Condition Remove the sample and wipe gently with a cotton cloth. Ensure no visible free water film remains on the surface. Weigh the sample → SSD Mass (A). 3. Oven Drying Place SSD sample in oven at 100–110°C for 24 hours. Cool it and weigh → Oven‑Dry Mass (B). 4. Repeat Trial Repeat the procedure on another sample and take the average. Calculation Water Absorption (%) = (A − B) / B × 100 Where: A = SSD Mass of aggregate B = Oven‑Dry Mass of aggregate Example If: A (SSD Mass) = 2045 g B (Oven-Dry Mass) = 2000 g Water Absorption (%) = (2045 − 2000) / 2000 × 100 = 45 / 2000 × 100 = 2.25% Importance in Construction Mix Design Adjustments: Highly absorptive aggregates steal mix water → affects workability. Durability: Higher absorption = higher porosity → weaker freeze-thaw and weathering resistance. ✔️ Typical Acceptable Limits Aggregate Type Max Water Absorption (%) Coarse Aggregate (Normal concrete) ≤ 2% Fine Aggregate (Sand) ≤ 3% For high-performance or severe exposure concrete, stricter limits may apply. Background & Standard Reference The Water Absorption Test is covered under IS 2386 (Part 3) – Specific Gravity, Density, Voids, Absorption and Bulking. This test provides insight into the internal pore structure of aggregates, which directly affects concrete durability, water demand, and long‑term performance. Aggregates with excessive pores tend to absorb more water, which may lead to reduced compressive strength and increased shrinkage. By determining absorption, engineers calibrate mix water content accurately to achieve the target workability and strength parameters. Factors Affecting Water Absorption Aggregate Type: Crushed rock typically has lower absorption than natural aggregates. Surface Texture: Rough, angular particles may retain more surface moisture. Pore Structure: Aggregates with interconnected pores have higher absorption levels. Weathering: Older, weathered aggregates tend to be more porous. Mineral Composition: Some minerals inherently exhibit higher porosity. Significance of SSD Condition The SSD (Saturated Surface Dry) condition is critical because it represents the state where internal pores are full of water while the exterior surface is dry. This allows mix water calculations to remain accurate. If aggregates are not brought to SSD before batching, they either absorb mix water (leading to lower workability) or contribute excess water (making the mix too wet). The SSD condition ensures correct water‑cement ratio, the single most important factor governing concrete strength. Impact on Concrete Performance Water absorption is directly linked to aggregate quality. Aggregates with low absorption are denser and more durable, making them suitable for high‑strength and long‑life structures. On the other hand, aggregates with high absorption may lead to increased permeability, reduced freeze‑thaw resistance, and potential durability issues. Additionally, when absorption is high, the concrete mix becomes unpredictable without proper adjustments, affecting slump, cohesiveness, and compaction. Precautions Ensure aggregates are completely submerged during the 24‑hour soaking period. Wipe surface moisture gently—over‑drying may lead to inaccurate SSD readings. Do not exceed oven temperature beyond 110°C to avoid thermal damage. Use a calibrated balance for precise mass measurements. Allow oven‑dry samples to cool in a desiccator if available, to prevent moisture uptake from air. Notes for Field Engineers In site conditions, aggregates stored in open yards exhibit varying levels of moisture. Regular absorption testing helps determine free moisture correction during batching to maintain consistent mix quality. For automated batching plants, entering accurate absorption values ensures the batching software adjusts water content correctly. This prevents issues such as plastic shrinkage, excessive bleeding, or segregation in fresh concrete. IS Code References IS Code Description IS 2386 (Part 3) Methods of Test for Aggregates – Specific Gravity, Density, Voids & Water Absorption IS 383 Specification for Coarse and Fine Aggregates for Concrete IS 456 General concrete requirements & material quality guidance Frequently Asked Questions (FAQ) 1. What is a good water absorption value for coarse aggregates? For most concrete works, water absorption should be ≤ 2%. Lower values indicate denser and more durable aggregates. 2. Why is SSD condition important? SSD ensures that aggregate pores are filled without free surface water. This prevents errors in mix design water calculations. 3. Can high water absorption affect concrete strength? Yes. Aggregates with high absorption draw water from the concrete mix, reducing effective W/C ratio and causing poor workability and potential strength loss. 4. How often should this test be performed? Typically during material approval and periodically during construction to ensure consistent aggregate quality. 5. Do different rocks have different absorption characteristics? Yes. Dense rocks like basalt and granite have low absorption. Porous rocks like sandstone and lightweight aggregates have higher absorption. Related Aggregate Tests for Highway & Concrete Works Explore detailed test procedures, calculations and acceptance criteria as per IS, MoRTH & IRC specifications: ✅ Aggregate Impact Value (AIV) Test – Toughness of Aggregates ✅ Los Angeles Abrasion Test – Wear & Abrasion Resistance ✅ Aggregate Crushing Value (ACV) Test – Strength Evaluation ✅ Flakiness & Elongation Index Test – Shape Characteristics ✅ Water Absorption Test – Durability & Porosity Check Pro Tip: Use AIV, ACV, Los Angeles Abrasion, and Shape & Water Absorption Tests together to ensure aggregate suitability for bituminous layers & cement concrete as per MoRTH Section 400 & 500.
Aggregate Crushing Value Test — Procedure, Calculation & Limits | QC for Pavements Aggregate Crushing Value (ACV) Test — Procedure, Calculation & Acceptance Limits Quick lab method for QC of aggregates used in concrete pavements — Field & Lab Overview The Aggregate Crushing Value (ACV) test measures the resistance of an aggregate sample to crushing under a gradually applied compressive load. The result helps determine suitability of aggregates for different pavement layers and wearing surfaces. Why This Test Matters in Highway Construction In highway and pavement engineering, aggregates form the backbone of structural layers such as Sub-Base, Base, and Surface Courses. Their strength directly influences the ability of pavements to resist traffic loads, impacts, and repeated loading without excessive crushing or breakdown. The Aggregate Crushing Value (ACV) test provides a relative measure of the resistance of aggregates to crushing under gradually applied compressive loads, as defined by IS 2386 (Part IV). Aggregates with a low ACV (i.e., lower percentage of fines) indicate higher strength and durability, which is critical for long-lasting road surfaces and reduced maintenance costs. As per standard practice, the ACV of aggregates used in wearing surfaces (e.g., concrete pavements) should be controlled rigorously to ensure structural performance over the design life. Aggregates failing this test may lead to premature rutting, surface degradation, and loss of serviceability. Apparatus Item Specification / Notes Steel cylindrical measure Internal diameter 115 mm, height 180 mm Plunger / piston Diameter 150 mm (for main apparatus) Tamping rod Diameter 16 mm (rounded end), length 450–600 mm Balance Capacity ≈ 3 kg with 0.01 g accuracy Compressive testing machine 40 tonnes capacity, uniform loading rate 4 tonnes/min IS sieves 12.5 mm, 10 mm, and 2.36 mm Sample Selection & Preparation Use aggregate passing 12.5 mm and retained on 10 mm IS sieve. Ensure the aggregates are surface-dry (no visible free moisture). Sample weight: as required by the cylinder capacity — record dry weight (W1). Procedure (Step-by-step) Fill the cylindrical measure in three approximately equal layers. Tamp each layer 25 times using the rounded end of the tamping rod. After the third layer, level off the surface using the tamping rod as a straight edge. Insert the plunger carefully so it rests level on the sample surface. Place the cylinder & plunger assembly on the compression testing machine. Apply load at a uniform rate of 4 tonnes per minute until the total load reaches 40 tonnes, then release the load. Remove crushed material and sieve through a 2.36 mm IS sieve; collect fines that pass the sieve. Weigh the portion passing 2.36 mm (W2). Repeat the test on a second sample and record both W2 values. Calculation Aggregate Crushing Value (ACV) is the percentage ratio of crushed fines to the total sample weight. Aggregate Crushing Value = (W2 / W1) × 100 Where: W1 = Total dry weight of sample W2 = Weight of material passing 2.36 mm IS sieve Report: Mean of two test results Results & Reporting Report the mean of the two test values as the final ACV for the aggregate sample. Include: Sample identification and date Apparatus used and calibration status W1 and W2 values for both trials and the mean ACV Any deviations from standard procedure Acceptance Limits Application Maximum ACV (%) Cement concrete pavements 30 Wearing surfaces 45 Frequently Asked Questions Why do we use a 2.36 mm sieve for fines? 2.36 mm is the standard IS limit for defining crushed fines in this test — it provides a consistent basis to compare strength characteristics across aggregate sources. What if my aggregate grading differs? If grading is outside the specified range (12.5–10 mm) use a representative fraction or follow the standard practice for coarse/fine fractions as specified in the relevant code. Notes & Best Practices Always run two trials and report the mean to reduce random error. Ensure the compression machine platen and the plunger are clean and parallel before applying load. Record ambient conditions and any visible degradation of sample during handling. Quick Checklist Aggregate: 12.5–10 mm Tamping: 25 blows/layer Loading: 4 t/min to 40 t Sieve for fines: 2.36 mm Acceptable ACV: <=30% (concrete pavements) Useful snippets <strong>ACV = (W2 / W1) × 100</strong> Use this procedure Related Aggregate Tests for Highway & Concrete Works Explore detailed test procedures, calculations and acceptance criteria as per IS, MoRTH & IRC specifications: ✅ Aggregate Impact Value (AIV) Test – Toughness of Aggregates ✅ Los Angeles Abrasion Test – Wear & Abrasion Resistance ✅ Aggregate Crushing Value (ACV) Test – Strength Evaluation ✅ Flakiness & Elongation Index Test – Shape Characteristics ✅ Water Absorption Test – Durability & Porosity Check 📌 Pro Tip: Use AIV, ACV, Los Angeles Abrasion, and Shape & Water Absorption Tests together to ensure aggregate suitability for bituminous layers & cement concrete as per MoRTH Section 400 & 500.
he Liquid Limit (LL) Test determines the water content at which soil changes from a plastic to a liquid state. It is a key parameter for classifying soils, evaluating their plasticity, and assessing suitability for highway and civil engineering works.
Plastic Limit of Soil Test (PL Test) – Procedure, Calculations & Examples Plastic Limit of Soil Test (PL Test) Objective: To determine the plastic limit of soil (PL), which is the moisture content at which soil starts to exhibit plastic behavior. Apparatus Required Evaporating dish Spatula Glass plate Moisture containers with lids Rolling rod (3 mm diameter) Sensitive balance (accuracy 0.01 g) Oven (temperature 105–110 °C) Procedure for Plastic Limit Test Take about 20 g of dry, pulverized soil passing through a 425 μm IS sieve. Mix the soil thoroughly with distilled water until it forms a plastic paste. Form a small ball of soil and roll it between fingers and a glass plate to form a thread. Apply uniform pressure and roll at a speed of 80–90 strokes per minute. Continue rolling until the thread diameter reaches 3 mm. Observe crumbling: Thread crumbles below 3 mm → moisture content is above PL Thread crumbles above 3 mm → moisture content is below PL Repeat rolling and kneading until the thread crumbles at exactly 3 mm diameter. Collect the crumbled soil immediately in a moisture container, cover it, and weigh. Dry the sample in an oven to determine the dry weight and calculate moisture content. Repeat the test at least three times and report the average value as PL. Calculations Plasticity Index (PI or Ip): PI = Liquid Limit (LL) – Plastic Limit (PL) PI = WL – WP Toughness Index (TI or IT): TI = IP / IF (Where IF = Flow Index from Liquid Limit Test) Liquidity Index (LI or IL): LI = (W – WP) / IP W = Natural moisture content of soil Consistency Index (CI or IC): CI = (WP – W) / IP Notes Maintain uniform rolling strokes for accurate results. Determine moisture content immediately after crumbling. The Plastic Limit helps classify soil into low, medium, or high plasticity. 🔬 Related Highway & Pavement Tests Explore detailed test procedures, calculations and acceptance criteria as per IS, MoRTH & IRC specifications: ✅ CBR Test – Subgrade Strength ✅ Field Density Test (Core Cutter) ✅ Plasticity Index Test ✅ Free Swell Index Test 🪨 Aggregate Tests: ✅ Aggregate Impact Value Test ✅ Los Angeles Abrasion Test ✅ Aggregate Crushing Value Test ✅ Aggregate Water Absorption Test 🛢️ Bitumen Tests: ✅ Marshall Stability & Flow Test 🏗️ Cement & Concrete Tests: ✅ Fineness of Cement Test ✅ Slump Cone Test 📌 Pro Tip: Combine soil, aggregate, bitumen, and concrete tests to ensure comprehensive QA/QC on highway pavement layers as per MoRTH & IRC standards.
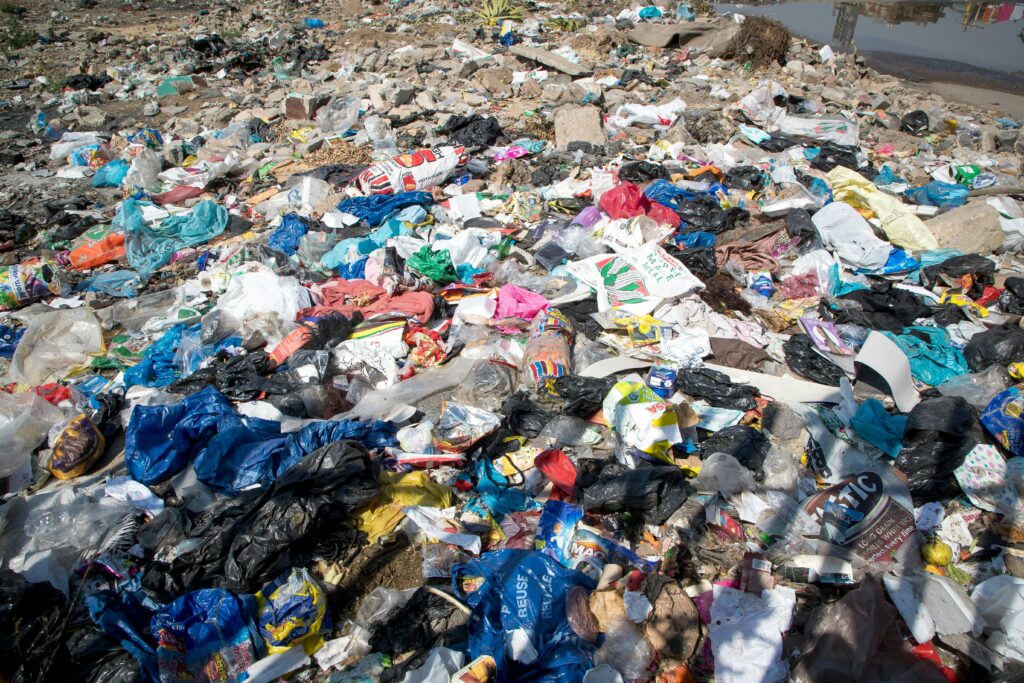
Step-by-step guide about how to use plastic waste in road construction
Clearing and Grubbing is the first activity before earthworks. It covers removal and disposal of vegetation including trees (up to 300 mm girth), bushes, shrubs, stumps, roots, grass, weeds, rubbish and top organic soil up to 150 mm thick. The scope includes draining stagnant water, backfilling pits created by uprooting trees and compacting to required density as per MoRTH Clause 305.3.4.
Clearing and Grubbing Methodology as per MoRTH Clause 201 Read More »