HIGHWAY QUALITY TEST

Precision Testing. Proven Quality. Safer Infrastructure.

Kishor Kumar

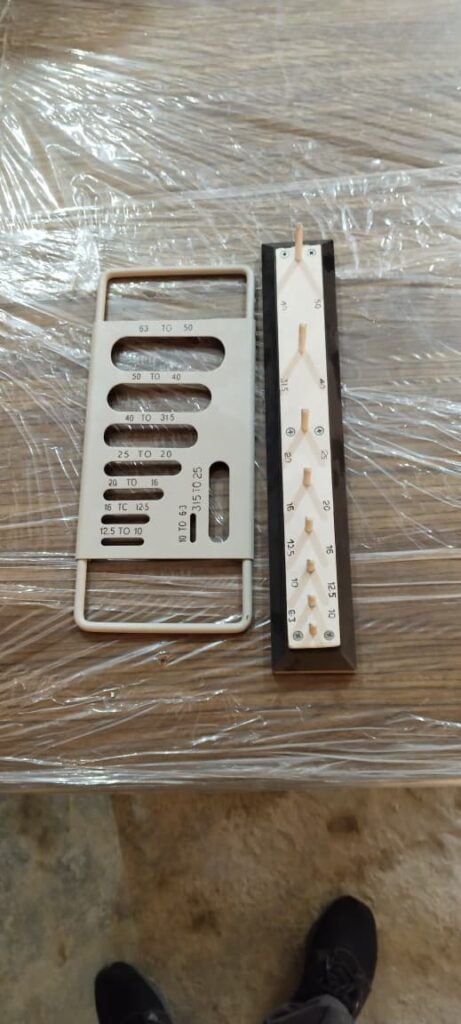
flakiness and elongation guage

Flakiness & Elongation Test

Flakiness & Elongation Index Test – Method Statement Flakiness & Elongation Index Test – IS 2386 Procedure with Calculation Procedure • Apparatus • IS Sieve Table • Results format OBJECT Assess aggregate particle shape quality using the Flakiness & Elongation Index Test as per IS 2386 (Part I). This essential aggregate shape test determines the percentage of flaky and elongated particles that can adversely affect compaction, interlocking, and overall pavement performance. Excessive flaky and elongated aggregates reduce load-bearing capacity, increase voids, and lead to premature failures such as rutting, cracking, and surface deformation in flexible pavements. Therefore, strict compliance with IS specifications is critical for ensuring structural durability and long service life. This practical, site-ready guide covers: Required apparatus and gauge dimensions Step-by-step laboratory procedure Calculation formulas for Flakiness Index (FI) and Elongation Index (EI) Permissible limits as per MoRTH and IS standards Interpretation tips for QA/QC engineers Designed specifically for site engineers, QA/QC teams, and highway professionals, this guide ensures accurate testing, proper documentation, and informed decision-making for high-performance pavement construction. APPARATUS The apparatus for the shape tests consists of the following: A standard thickness gauge A standard length gauge IS sieves of sizes: 63, 50, 40, 31.5, 25, 20, 16, 12.5, 10 and 6.3 mm A balance of capacity 5 kg, readable and accurate up to 1 g The particle shape of aggregates is determined by the percentages of flaky and elongated particles contained in it. For base course and construction of bituminous and cement concrete types, the presence of flaky and elongated particles are considered undesirable as these cause inherent weakness with possibilities of breaking down under heavy loads. Thus, evaluation of shape of the particles, particularly with reference to flakiness and elongation is necessary. The Flakiness Index of aggregates is the percentage by weight of particles whose least dimension (thickness) is less than three-fifths (0.6 times) of their mean dimension. This test is not applicable to sizes smaller than 6.3 mm. The Elongation Index of an aggregate is the percentage by weight of particles whose greatest dimension (length) is greater than nine-fifths (1.8 times) their mean dimension. This test is also not applicable for sizes smaller than 6.3 mm. PROCEDURE Sieve the sample through the IS sieves (as specified in the table). Take a minimum of 200 pieces of each fraction to be tested and weigh them or take the maximum number of pieces available up to 200 Nos. In order to separate the flaky materials, gauge each fraction for thickness on a thickness gauge. The width of the slot used should be of the dimensions specified in column (4) of the table for the appropriate size of the material. Weigh the flaky material passing the gauge to an accuracy of at least 0.1 per cent of the test sample. In order to separate the elongated materials, gauge the non-flaky material for length on a length gauge. The width of the slot used should be of the dimensions specified in column (6) of the table for the appropriate size of the material. Weigh the elongated material retained on the gauge to an accuracy of at least 0.1 per cent of the test sample. IS SIEVE & GAUGE TABLE Passing through IS Sieve, mm Retained on IS Sieve, mm Weight of fraction (200 pieces), g Thickness gauge size, mm Weight passing thickness gauge (Xi) Length gauge size, mm Weight retained on length gauge (Yi) 63 50 W1 23.90 X1 – – 50 40 W2 27.00 X2 81.00 Y1 40 31.5 W3 19.50 X3 58.00 Y2 31.5 25 W4 16.95 X4 – – 25 20 W5 13.50 X5 40.5 Y3 20 16 W6 10.80 X6 32.4 Y4 16 12.5 W7 8.55 X7 25.5 Y5 12.5 10 W8 6.75 X8 20.2 Y6 10 6.3 W9 4.89 X9 14.7 Y7 Total W = X = Y = OBSERVATIONS and: FORMULAE Record every fraction’s weights clearly. Use at least two significant figures for percentages and record sample piece counts. Flakiness Index = ((X1 + X2 + …) / (W1 + W2 + …)) × 100 Elongation Index = ((Y1 + Y2 + …) / (W1 + W2 + …)) × 100 Fraction Total pieces taken (Wi) Flaky weight (Xi) Elongated weight (Yi) Remarks 63–50 mm 50–40 mm 40–31.5 mm 31.5–25 mm 25–20 mm 20–16 mm 16–12.5 mm 12.5–10 mm 10–6.3 mm Total RESULT I. Flakiness Index = X II. Elongation Index = Y NOTES & REFERENCES This document preserves the original technical content. Do not alter the definitions if your contract specification references a specific IS edition. Reference: IS 2386 Part 1 – Methods of Test for Aggregates for Concrete (Particle Shape Tests). Record environmental conditions and the balance calibration status with every test batch for traceability. Permissible Limits as per MoRTH Application Combined FI + EI Limit Bituminous Concrete (BC) ≤ 30% Dense Bituminous Macadam (DBM) ≤ 35% Wet Mix Macadam (WMM) ≤ 35% Note: Always verify latest MoRTH revision applicable to your contract. Document: • Generated: 20 Nov 2025 Enter Values to Calculate Indices W Values X Values Y Values Calculate Results: Flakiness Index: 0% Elongation Index: 0% Quick Reference: Flakiness & Elongation Index Test Applicable Aggregate Size: Only aggregates ≥6.3 mm are tested. Minimum Sample Count: 200 pieces per sieve fraction (or maximum available). Flakiness Index Criterion: Particles with thickness < 0.6 × mean size. Elongation Index Criterion: Particles with length > 1.8 × mean size. Required Gauges: Thickness gauge for flakiness; Length gauge for elongation. Accuracy: Weigh materials to at least 0.1% accuracy of sample weight. Outcome: FI = (Flaky Weight / Total Weight) × 100; EI = (Elongated Weight / Total Weight) × 100. Purpose: Ensures aggregates are suitable for pavement and concrete strength requirements. Top FAQs – Flakiness & Elongation Index Test What is the minimum aggregate size for these tests? Aggregates smaller than 6.3 mm are not tested. Why are flaky and elongated particles undesirable? They reduce pavement strength and break easily under heavy loads. How many aggregate pieces must be tested? A

Flakiness & Elongation Test Read More »

Aggregate
cube testing machine

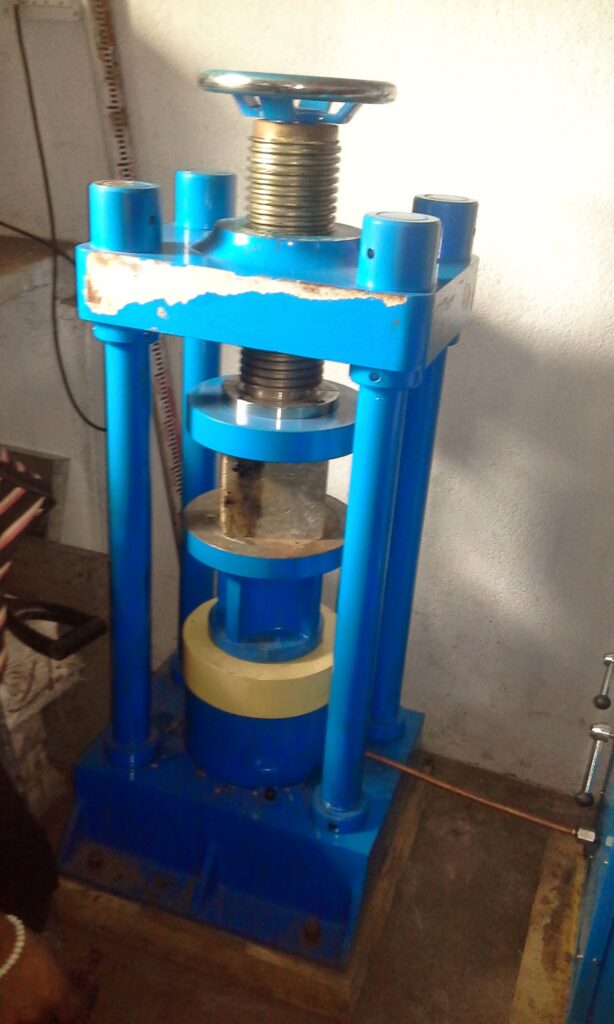
Compressive Strength of Concrete Cube Test (IS 516 Guide)

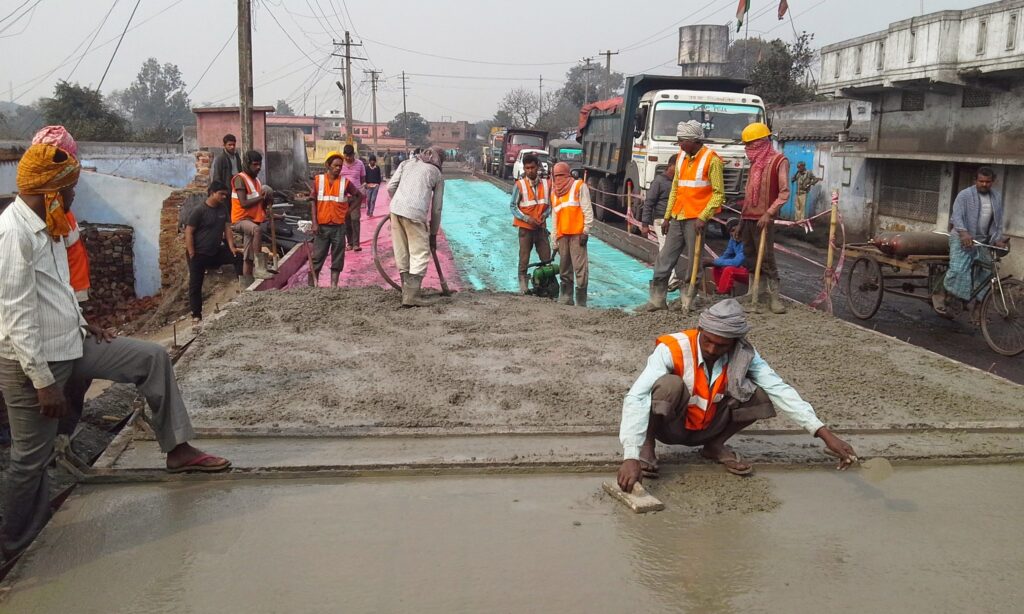
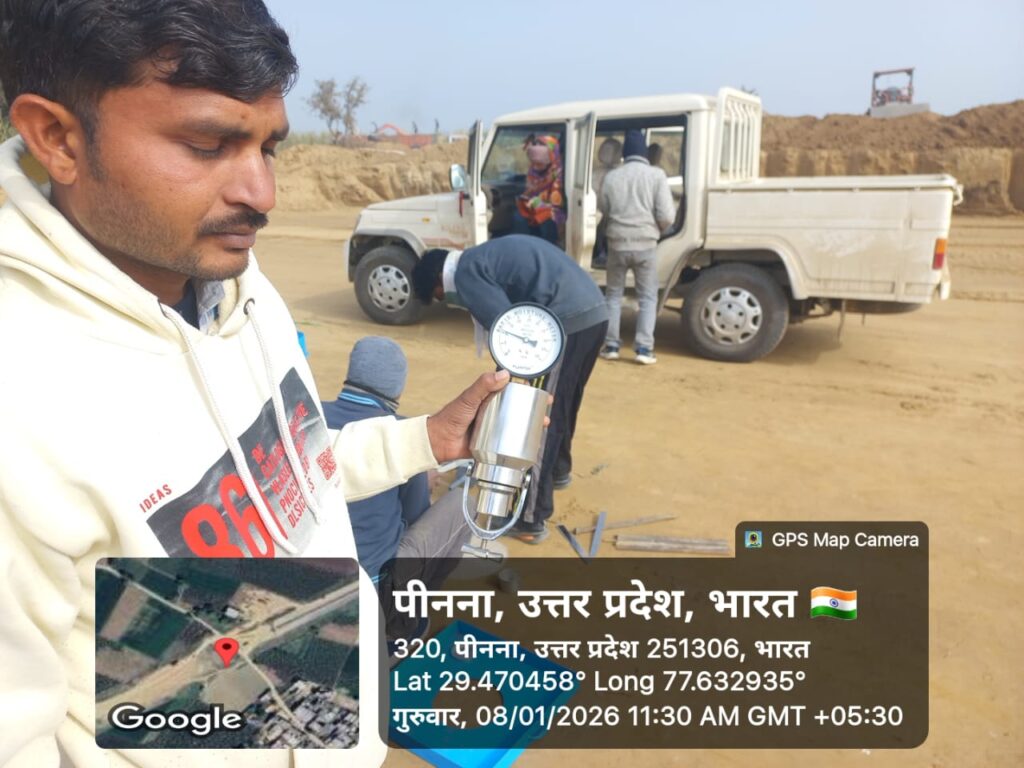
Concrete Cube Test – IS 516 Procedure, Compressive Strength & Formula 1. Objective The Concrete Cube Compressive Strength Test, conducted in accordance with IS 516 (Part 1/Sec 1), is the most widely accepted method for assessing the compressive strength of hardened concrete. It is one of the most critical quality control tests used to verify that concrete has achieved the specified design strength and complies with the requirements of IS 456, MoRTH Specifications, project specifications, and contractual acceptance criteria. The test is routinely performed on highways, bridges, buildings, industrial facilities, airports, and other infrastructure projects to ensure the structural safety, durability, and long-term performance of concrete. For EPC contractors, consultants, and QA/QC teams, concrete cube testing forms an integral part of the Quality Assurance and Quality Control (QA/QC) system. The reliability of the test depends not only on the Compression Testing Machine (CTM) but also on the accuracy of every preceding activity, including representative sampling, cube casting, compaction, curing, specimen handling, identification, and laboratory testing. Failure to follow standard procedures at any stage can significantly influence the measured compressive strength and may result in incorrect acceptance or rejection of concrete. Concrete test specimens are generally prepared using standard cube moulds of 150 × 150 × 150 mm, which are widely used for routine structural concrete testing. Where the nominal maximum size of coarse aggregate does not exceed 20 mm, 100 × 100 × 100 mm cube moulds may also be used in accordance with the applicable provisions of IS 516. Specimens are normally tested at 7 days to evaluate early strength development and at 28 days to determine the characteristic compressive strength. Additional testing ages may be specified for high-performance concrete, mass concrete, or project-specific requirements. Scope of the Concrete Cube Test Procedure A standard Concrete Cube Compressive Strength Test consists of the following sequential activities: Inspection, cleaning, assembly, and lubrication of cube moulds before casting. Collection of representative fresh concrete samples from the point of discharge or placement. Recording of specimen identification, concrete grade, batch details, casting location, date, and time for complete traceability. Layer-wise placement of concrete into cube moulds followed by proper compaction using a tamping rod or vibration table, depending on the workability of the concrete. Finishing the top surface flush with the mould and marking each specimen for identification. Protecting freshly cast specimens from vibration, direct sunlight, excessive moisture loss, and mechanical disturbance during the initial setting period. Demoulding the specimens after 24 ± ½ hours and transferring them immediately to a curing tank maintained under standard curing conditions. Continuous water curing until the specified testing age. Testing the specimens using a calibrated Compression Testing Machine (CTM) in accordance with IS 516. Calculating the compressive strength by dividing the maximum failure load by the loaded cross-sectional area of the specimen. Comparing the test results with the acceptance criteria specified in IS 456, MoRTH Specifications, project Quality Assurance Plans (QAP), and other applicable contract documents. Importance of Proper Testing The accuracy of the Concrete Cube Compressive Strength Test depends on strict adherence to standard laboratory procedures. Common errors such as improper sampling, inadequate compaction, poor curing, damaged specimens, incorrect loading rates, or inaccurate specimen identification can produce misleading test results. Therefore, every stage of the testing process shall be carried out in accordance with IS 516 and the approved Quality Assurance procedures to ensure reliable, repeatable, and technically valid results. Benefits of Routine Concrete Cube Testing Verifies that the concrete has achieved the specified grade (M20, M25, M30, M40, and higher). Detects deficiencies in batching, mixing, transportation, placement, compaction, and curing practices at an early stage. Evaluates the consistency and quality of concrete production throughout the project. Confirms the performance of the approved concrete mix design under actual site conditions. Demonstrates compliance with IS 456, IS 516, MoRTH Specifications, consultant requirements, and contractual QA/QC procedures. Provides documented laboratory records for inspections, audits, quality reviews, and client approvals. Enhances confidence in the structural safety, durability, and long-term service performance of concrete structures. 👷 Expert Recommendation Concrete cube strength should never be evaluated in isolation. When low-strength results are obtained, review the complete quality control cycle, including material quality, batching accuracy, water-cement ratio, slump test results, transportation time, placing method, compaction, curing conditions, CTM calibration, and testing procedures. In practice, many low-strength results are caused by deficiencies in sampling, specimen preparation, curing, or testing rather than by the concrete mix itself. A systematic investigation should always be carried out before concluding that the concrete has failed. This guide presents the complete IS 516 Concrete Cube Compressive Strength Test Procedure in a practical, step-by-step sequence followed on major NHAI, MoRTH, EPC, HAM, BOT, and O&M projects. It is intended as a comprehensive reference for site engineers, material engineers, QA/QC engineers, laboratory technicians, consultants, contractors, engineering students, and project managers responsible for concrete quality control and acceptance testing. 2. Apparatus Required The following apparatus and equipment are required for casting, curing, and testing concrete cube specimens in accordance with IS 516 (Part 1/Sec 1). All equipment shall be clean, properly maintained, and calibrated (where applicable) to ensure accurate and reliable test results. Apparatus Specification / Requirement Purpose Cube Moulds 150 × 150 × 150 mm or 100 × 100 × 100 mm, steel/cast iron Preparation of standard concrete test specimens. Mixing Tray Clean, rigid and non-absorbent Mixing and remixing representative concrete samples before casting. Scoop / Shovel Steel Handling and transferring fresh concrete into cube moulds. Tamping Rod 16 mm diameter, 600 mm long, rounded ends Manual compaction of concrete (35 strokes per layer as specified). Steel Trowel / Float Standard masonry trowel Levelling and finishing the top surface of the concrete cube. Vibrating Table or Needle Vibrator Suitable capacity Mechanical compaction of workable concrete where specified. Concrete Mixer (If Required) Pan or drum type Uniform mixing of concrete for laboratory or trial batches. Vernier Caliper / Steel Scale Calibrated Measurement of cube dimensions before compressive strength testing. Curing Tank Maintained at 27 ± 2°C Standard water curing of

Compressive Strength of Concrete Cube Test (IS 516 Guide) Read More »

Concrete Work

Profile Corrective Course DBM

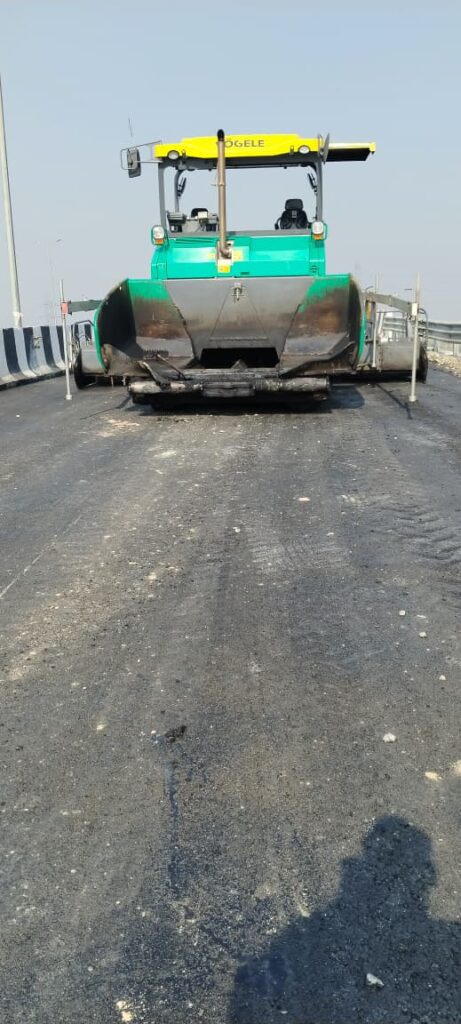
Profile Corrective Course (DBM) Construction Methodology | MoRTH Profile Corrective Course (Dense Bituminous Macadam) – Construction Methodology Profile Corrective Course (PCC) using Dense Bituminous Macadam (DBM) is executed to correct pavement profile irregularities such as depressions, sags, uneven camber and surface undulations before laying the final overlay. 1.0 Scope and Surface Preparation The Profile Corrective Course is a bituminous layer of variable thickness (typically 50–100 mm) laid over an existing granular or bituminous surface to restore the correct longitudinal and cross profile as per approved drawings. 1.1 Existing Bituminous Surface Repairs: Potholes, cracks and distressed areas shall be repaired as per MoRTH Clauses 3004.2 & 3004.3. Scarifying: Where specified, existing bituminous layer shall be scarified without disturbing underlying layers. Base Preparation: Exposed surface reworked, compacted and primed if required as per Clause 502. Tack Coat: Bituminous emulsion applied uniformly before laying PCC DBM. 1.2 Existing Granular Surface Surface cleaned of loose material and dust. Priming carried out as per MoRTH Clause 502 before bituminous layer. Surface to be firm, dry and broom-cleaned. 1.3 Pre-Laying Checks Existing top levels shall be jointly checked and recorded before and after preparation to confirm thickness and profile correction. 2.0 Plant, Machinery & Equipment Sl. No. Equipment Quantity 1 Batch Type Hot Mix Plant (200 TPH) 01 2 Sensor Paver with Auto Screed Control 01 3 Pneumatic Tyred Roller 01 4 Tandem Vibratory Roller 02 5 Bitumen Sprayer 01 6 Hydraulic Broom / Air Compressor 01 7 Water Tanker 01 8 Tipping Trucks As required 3.0 Materials & Mix Production 3.1 Materials Coarse & fine aggregates from approved quarries Bitumen: VG-30 / VG-40 (IS:73) Tack Coat: Rapid setting bituminous emulsion 3.2 Job Mix Formula (JMF) JMF shall be prepared in the site laboratory using Marshall Method and approved by IE/PMC. The procedure is identical to DBM/BC mix design as per MoRTH Section 500. 3.3 Hot Mix Plant Operation Bitumen storage temperature: 150–165°C Aggregate drying temperature: 150–170°C Mixing carried out in controlled, dust-free environment Maximum mix temperature not exceeding 165°C 4.0 Laying & Compaction 4.1 Transportation of Mix Mix transported in covered tipping trucks. Truck beds coated with release agent. Mix temperature at dispatch: 155–165°C. 4.2 Tack Coat Application Rate of application: 0.25–0.30 kg/m² Applied by mechanical sprayer DBM laid only after tack coat breaks 4.3 Laying & Finishing Sensor wire fixed at 10 m interval for profile control Minimum laying temperature: 125°C Loose thickness allowance: approx. 25% Manual laying permitted in confined areas 4.4 Compaction Rolling by vibratory roller followed by PTR Rolling from lower edge to higher edge Compaction continued until specified density achieved Joints cut full depth and edges painted with hot bitumen 5.0 Quality Control & Traffic Management Core cutting after 24 hours for density verification Routine bitumen testing for each consignment Surface finish as per MoRTH Clause 902 Traffic opened minimum 24 hours after completion Traffic managed using cones, barricades and flagmen Frequently Asked Questions – PCC DBM What is PCC? A corrective bituminous layer to restore pavement profile. Typical thickness? 50–100 mm per layer. Where used? Depressions, sags, uneven camber. Material used? DBM with VG-30/VG-40 bitumen. Surface preparation? Repair, scarify, clean, prime/tack. Compaction? Vibratory roller + PTR. Joint treatment? Full-depth cut with hot bitumen coating. Traffic opening? After minimum 24 hours. 🏗️ Highway Construction Methodology Hub Standard construction methodologies for highway works as per MoRTH 5th Revision and IRC Specifications. ✅ Earthwork Methodology ✅ Clearing & Grubbing Methodology ➡️ ✅ Embankment Construction Methodology ➡️ ✅ Flyash Embankment Construction Methodology ➡️ ✅ Subgrade Construction Methodology ➡️ ✅ Granular Work Methodology ✅ Granular Sub-Base (GSB) Methodology ➡️ ✅ Wet Mix Macadam (WMM) Methodology ➡️ ✅ Bituminous Work Methodology ✅ Prime Coat Application Methodology ➡️ ✅ Tack Coat Application Methodology ➡️ ✅ Dense Bituminous Macadam (DBM) Methodology ➡️ ✅ Bituminous Concrete (BC) Methodology ➡️ ✅ Profile Corrective Course of DBM ➡️ ✅ Use of Waste Plastic in Bitumen ➡️ ✅ Use of Waste Plastic in Road Construction ➡️ ✅ Thermoplastic Road Marking Methodology ➡️ ✅ Concrete Methodology ✅ Dry Lean Concrete (DLC) Methodology ➡️ ✅ PQC Road Construction Methodology ➡️ ✅ Kerb Construction Methodology ➡️

Profile Corrective Course DBM Read More »

Bituminous Work

Water Absorption Test

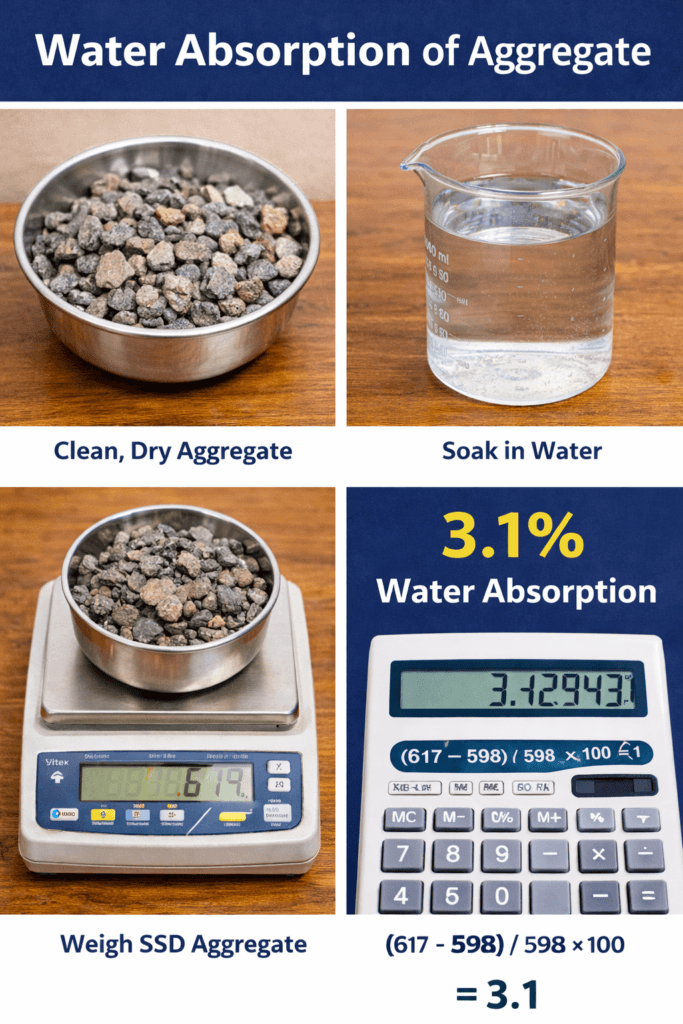
Water Absorption Test of Coarse Aggregate — Objective, Procedure & Calculation Water Absorption Test of Coarse Aggregate The Water Absorption Test determines the percentage of water absorbed by coarse aggregates, providing an indication of pore structure, density, and suitability for high-quality concrete and asphalt works. Objective To determine the Water Absorption (%) of a coarse aggregate sample using SSD and Oven-dry mass values. Apparatus Required Tray or suitable container Balance (Capacity ≥ 3 kg, Accuracy 0.5 g) Oven (100–110°C) Cotton cloth Test Procedure 1. Immersion (Saturation) Take at least 2000 g (2 kg) of aggregate. Immerse in clean water for 24 hours to fill internal pores. 2. Saturated Surface Dry (SSD) Condition Remove the sample and wipe gently with a cotton cloth. Ensure no visible free water film remains on the surface. Weigh the sample → SSD Mass (A). 3. Oven Drying Place SSD sample in oven at 100–110°C for 24 hours. Cool it and weigh → Oven‑Dry Mass (B). 4. Repeat Trial Repeat the procedure on another sample and take the average. Calculation Water Absorption (%) = (A − B) / B × 100 Where: A = SSD Mass of aggregate B = Oven‑Dry Mass of aggregate Example If: A (SSD Mass) = 2045 g B (Oven-Dry Mass) = 2000 g Water Absorption (%) = (2045 − 2000) / 2000 × 100 = 45 / 2000 × 100 = 2.25% Importance in Construction Mix Design Adjustments: Highly absorptive aggregates steal mix water → affects workability. Durability: Higher absorption = higher porosity → weaker freeze-thaw and weathering resistance. ✔️ Typical Acceptable Limits Aggregate Type Max Water Absorption (%) Coarse Aggregate (Normal concrete) ≤ 2% Fine Aggregate (Sand) ≤ 3% For high-performance or severe exposure concrete, stricter limits may apply. Background & Standard Reference The Water Absorption Test is covered under IS 2386 (Part 3) – Specific Gravity, Density, Voids, Absorption and Bulking. This test provides insight into the internal pore structure of aggregates, which directly affects concrete durability, water demand, and long‑term performance. Aggregates with excessive pores tend to absorb more water, which may lead to reduced compressive strength and increased shrinkage. By determining absorption, engineers calibrate mix water content accurately to achieve the target workability and strength parameters. Factors Affecting Water Absorption Aggregate Type: Crushed rock typically has lower absorption than natural aggregates. Surface Texture: Rough, angular particles may retain more surface moisture. Pore Structure: Aggregates with interconnected pores have higher absorption levels. Weathering: Older, weathered aggregates tend to be more porous. Mineral Composition: Some minerals inherently exhibit higher porosity. Significance of SSD Condition The SSD (Saturated Surface Dry) condition is critical because it represents the state where internal pores are full of water while the exterior surface is dry. This allows mix water calculations to remain accurate. If aggregates are not brought to SSD before batching, they either absorb mix water (leading to lower workability) or contribute excess water (making the mix too wet). The SSD condition ensures correct water‑cement ratio, the single most important factor governing concrete strength. Impact on Concrete Performance Water absorption is directly linked to aggregate quality. Aggregates with low absorption are denser and more durable, making them suitable for high‑strength and long‑life structures. On the other hand, aggregates with high absorption may lead to increased permeability, reduced freeze‑thaw resistance, and potential durability issues. Additionally, when absorption is high, the concrete mix becomes unpredictable without proper adjustments, affecting slump, cohesiveness, and compaction. Precautions Ensure aggregates are completely submerged during the 24‑hour soaking period. Wipe surface moisture gently—over‑drying may lead to inaccurate SSD readings. Do not exceed oven temperature beyond 110°C to avoid thermal damage. Use a calibrated balance for precise mass measurements. Allow oven‑dry samples to cool in a desiccator if available, to prevent moisture uptake from air. Notes for Field Engineers In site conditions, aggregates stored in open yards exhibit varying levels of moisture. Regular absorption testing helps determine free moisture correction during batching to maintain consistent mix quality. For automated batching plants, entering accurate absorption values ensures the batching software adjusts water content correctly. This prevents issues such as plastic shrinkage, excessive bleeding, or segregation in fresh concrete. IS Code References IS Code Description IS 2386 (Part 3) Methods of Test for Aggregates – Specific Gravity, Density, Voids & Water Absorption IS 383 Specification for Coarse and Fine Aggregates for Concrete IS 456 General concrete requirements & material quality guidance Frequently Asked Questions (FAQ) 1. What is a good water absorption value for coarse aggregates? For most concrete works, water absorption should be ≤ 2%. Lower values indicate denser and more durable aggregates. 2. Why is SSD condition important? SSD ensures that aggregate pores are filled without free surface water. This prevents errors in mix design water calculations. 3. Can high water absorption affect concrete strength? Yes. Aggregates with high absorption draw water from the concrete mix, reducing effective W/C ratio and causing poor workability and potential strength loss. 4. How often should this test be performed? Typically during material approval and periodically during construction to ensure consistent aggregate quality. 5. Do different rocks have different absorption characteristics? Yes. Dense rocks like basalt and granite have low absorption. Porous rocks like sandstone and lightweight aggregates have higher absorption. HIGHWAY QUALITY TEST Download Water Absorption Test Excel Format Prepare professional Water Absorption Test reports with automatic calculations for Coarse Aggregates (40 mm, 20 mm, 10 mm), Sand, and Stone Dust. Save time, eliminate manual errors, and generate laboratory-ready reports instantly. ✅ What’s Included Automatic Water Absorption Calculations 40 mm Aggregate Format 20 mm Aggregate Format 10 mm Aggregate Format Sand Water Absorption Format Professional Laboratory Report Layout Print Ready (A4 Size) Editable Excel (.xlsx) Instant Download Lifetime Access 👷 Perfect For Highway Engineers Civil Engineers QA/QC Engineers Material Testing Laboratories Consultants Engineering Students 💰 Bundle: ₹149 Only CA (40,20,10 mm + Sand) + Stone Dust • One-Time Payment • Instant Access 🛒 Buy CA (40,20,10 mm + Sand) Excel – ₹99 🛒 Buy Stone Dust Excel – ₹49 ✔ Secure Payment  

Water Absorption Test Read More »

Aggregate

aggregate crushing value test

Aggregate Crushing Value Test

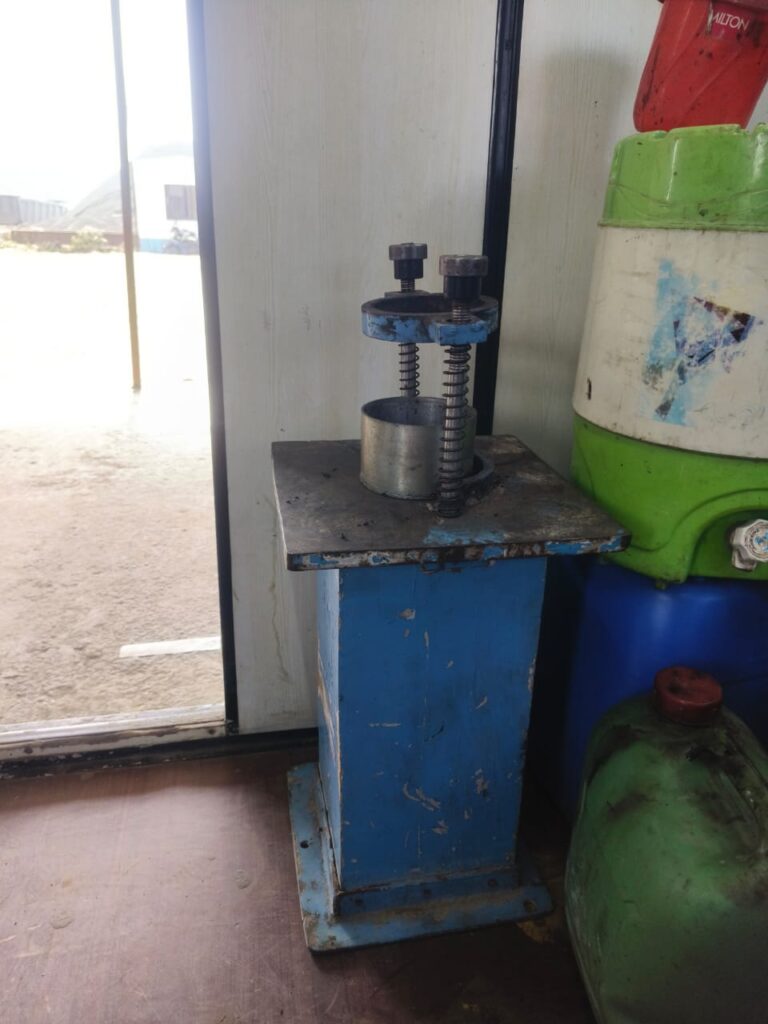
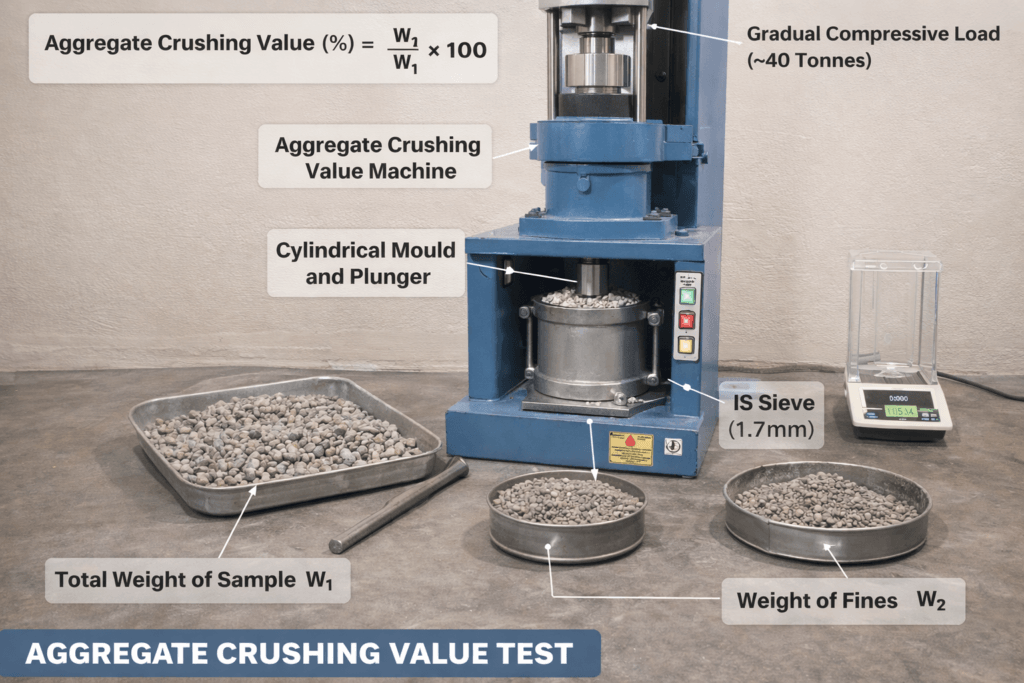
Aggregate Crushing Value Test — Procedure, Calculation & Limits | QC for Pavements Aggregate Crushing Value (ACV) Test — Procedure, Calculation & Acceptance Limits Quick lab method for QC of aggregates used in concrete pavements — Field & Lab Overview The Aggregate Crushing Value (ACV) test measures the resistance of an aggregate sample to crushing under a gradually applied compressive load. The result helps determine suitability of aggregates for different pavement layers and wearing surfaces. Why This Test Matters in Highway Construction In highway and pavement engineering, aggregates form the backbone of structural layers such as Sub-Base, Base, and Surface Courses. Their strength directly influences the ability of pavements to resist traffic loads, impacts, and repeated loading without excessive crushing or breakdown. The Aggregate Crushing Value (ACV) test provides a relative measure of the resistance of aggregates to crushing under gradually applied compressive loads, as defined by IS 2386 (Part IV). Aggregates with a low ACV (i.e., lower percentage of fines) indicate higher strength and durability, which is critical for long-lasting road surfaces and reduced maintenance costs. As per standard practice, the ACV of aggregates used in wearing surfaces (e.g., concrete pavements) should be controlled rigorously to ensure structural performance over the design life. Aggregates failing this test may lead to premature rutting, surface degradation, and loss of serviceability. Apparatus Item Specification / Notes Steel cylindrical measure Internal diameter 115 mm, height 180 mm Plunger / piston Diameter 150 mm (for main apparatus) Tamping rod Diameter 16 mm (rounded end), length 450–600 mm Balance Capacity ≈ 3 kg with 0.01 g accuracy Compressive testing machine 40 tonnes capacity, uniform loading rate 4 tonnes/min IS sieves 12.5 mm, 10 mm, and 2.36 mm Sample Selection & Preparation Use aggregate passing 12.5 mm and retained on 10 mm IS sieve. Ensure the aggregates are surface-dry (no visible free moisture). Sample weight: as required by the cylinder capacity — record dry weight (W1). Procedure (Step-by-step) The aggregate passing 12.5 mm IS sieve and retained on 10 mm IS sieve shall be selected for standard test. The aggregate should be in surface dry condition before testing. The cylindrical measure shall be filled by the test sample of aggregate in three layers of approximately equal depth, each layer being tamped 25 times by the rounded end of the tamping rod. After the third layer is tamped, using the tamping rod as a straight edge levels off the aggregate at the top of the cylindrical measure. Weigh the sample and repeat the test for another trial. The cylinder of the test apparatus shall be placed in position on the base plate; place one third of the test sample in this cylinder and tamp 25 times by the tamping rod. Similarly, the other two parts of the test specimen are added, each layer being subjected to 25 blows. The surface of the aggregates shall be levelled and insert the plunger so that it rests on this surface in level position. Keep the cylinder with the test sample and the plunger in position and place on the compression testing machine. Load is then applied through the plunger at a uniform rate of 4 tons per minute until the total load is 40 tonnes, and then release the total load. Remove the aggregates including the crushed portion from the cylinder and sieve on a 2.36 mm IS sieve. Collect the material, which passes this sieve. The above crushing test shall be repeated on second sample of the same weight in accordance with above test procedure. Thus two tests are made for the same specimen for taking an average value. Calculation Aggregate Crushing Value (ACV) is the percentage ratio of crushed fines to the total sample weight. Aggregate Crushing Value = (W2 / W1) × 100 Where: W1 = Total dry weight of sample W2 = Weight of material passing 2.36 mm IS sieve Report: Mean of two test results Results & Reporting Report the mean of the two test values as the final ACV for the aggregate sample. Include: Sample identification and date Apparatus used and calibration status W1 and W2 values for both trials and the mean ACV Any deviations from standard procedure Acceptance Limits Application Maximum ACV (%) Cement concrete pavements 30 Wearing surfaces 45 Frequently Asked Questions Why do we use a 2.36 mm sieve for fines? 2.36 mm is the standard IS limit for defining crushed fines in this test — it provides a consistent basis to compare strength characteristics across aggregate sources. What if my aggregate grading differs? If grading is outside the specified range (12.5–10 mm) use a representative fraction or follow the standard practice for coarse/fine fractions as specified in the relevant code. Notes & Best Practices Always run two trials and report the mean to reduce random error. Ensure the compression machine platen and the plunger are clean and parallel before applying load. Record ambient conditions and any visible degradation of sample during handling. Quick Checklist Aggregate: 12.5–10 mm Tamping: 25 blows/layer Loading: 4 t/min to 40 t Sieve for fines: 2.36 mm Acceptable ACV: <=30% (concrete pavements) Useful snippets <strong>ACV = (W2 / W1) × 100</strong> Use this procedure HIGHWAY QUALITY TEST Download Aggregate Crushing Value (ACV) Test Excel Format Prepare professional Aggregate Crushing Value (ACV) test reports in minutes using our ready-to-use Excel format with automatic calculations. Eliminate manual calculation errors and generate laboratory-ready reports instantly. 💰 Only ₹99 One-Time Payment • Instant Download • Lifetime Access 🛒 Buy ACV Test Excel Format ✔ Secure Payment   |   ✔ Instant Download   |   ✔ Editable Excel 🚀 BEST VALUE Upgrade to the Complete Aggregate Testing Excel Toolkit Need more than one Excel format? Save money with our Complete Aggregate Testing Excel Toolkit containing 19 professional Excel formats with automatic calculations, laboratory-ready observation sheets and printable reports. Why Buy the Complete Toolkit? ✔ One Excel Format = ₹99 ✔ 6 Individual Formats = ₹594 ✔ 10 Individual Formats = ₹990 ✔ 19 Individual Formats = ₹1,881 Get

Aggregate Crushing Value Test Read More »

Aggregate

© 2026 HIGHWAY QUALITY TEST. All rights reserved.

WhatsAppNeed Help?
Scroll to Top